Disclosure: This page contains commercial links. BizBot may earn a commission from qualifying purchases. Paid placements do not buy a better ranking. Read our affiliate disclosure.

Labor forecasting software predicts how many staff you need and when. Here is what it does, what it is worth, and which of the claims made for it survive checking.
- What it does: predicts staffing requirements from historical demand data
- Where the money is: less overtime from understaffing, less idle payroll from overstaffing
- What it costs: a subscription, an integration project, and the ongoing work of keeping the data clean
A note on the figures we removed. An earlier version of this article carried more than a dozen performance statistics with no sources: a 23% average cut in overtime, an 88% improvement in shift coverage, 95% forecast accuracy, a 13x ROI, a 95% reduction in scheduling time, a claim that 83% of employees would stay if they controlled their hours, an anonymous HR manager saying they cut $100,000 of overtime, and an anonymous utility with four precise improvement percentages. None could be traced. They have been removed. Three claims did check out and are cited below – one of which this article had been reporting incorrectly.
Manual vs. automated forecasting
| Aspect | Manual Methods | Automated Software |
|---|---|---|
| Accuracy | Depends on the scheduler’s experience | Depends on the quality of your historical data |
| Speed | Hours per schedule cycle | Minutes, once configured |
| Adaptability | Rescheduling is manual | Can adjust against live demand signals |
| Data use | What the scheduler remembers | Whatever you can feed it cleanly |
| Cost | No licence fee; risk of over and understaffing | Licence fee plus integration; better staffing fit |
Note the accuracy row. Automation does not remove the judgement problem, it moves it into your data. A site with two years of clean, granular transaction history will forecast well. A site with a spreadsheet of weekly totals will not, whatever software you point at it.
What is Labor Forecasting Software
Labor forecasting software predicts staffing requirements from historical data. It does two things: estimate demand, then convert that demand into a headcount by shift.
Main Features and Uses
- Predicts customer demand from past patterns
- Converts demand into required staff by time period and skill
- Flags where the resulting schedule breaches labour rules or your own cost targets
Vendors in this space include Paycor, Quinyx, Deputy, When I Work and Legion. We previously quoted specific accuracy percentages and customer counts for several of these. Those came from marketing pages rather than measured results, so they are gone. Ask each vendor for a reference customer of your size and sector, and ask that customer what their forecast error actually is.
Parts of a Forecasting System
1. Demand forecasting predicts sales, transactions, call volume or foot traffic for a future period.
2. Labor modeling converts that demand into required staff, applying your service standards, task times, skill requirements and legal constraints.
The second half is where implementations fail. Demand forecasting is a solved statistical problem for most businesses. Getting the labour standards right – how long a task actually takes, which staff can do it – is manual work that nobody wants to do, and a good demand forecast attached to wrong labour standards produces confidently wrong schedules.
Working with HR Systems
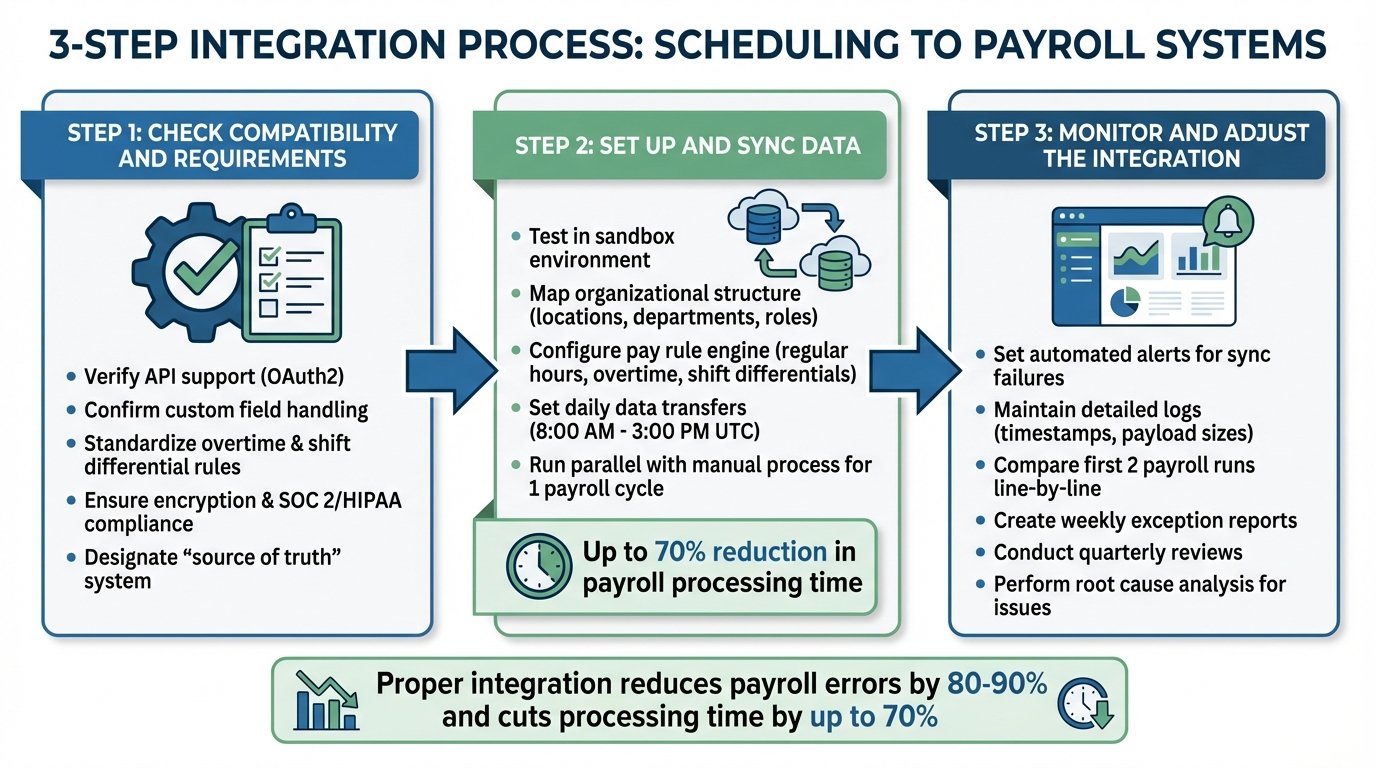
Forecasting software sits alongside your existing HR and payroll systems and draws on them. The connections that matter are the point-of-sale or transaction system for demand history, and payroll for pay rates, availability and hours worked.
Check the direction of those integrations during procurement. Reading data in is easy. Writing published schedules back to payroll and time-and-attendance is where projects stall.
Why Use Automated Labor Forecasting
Better Staff Planning
Automated forecasting replaces a scheduler’s estimate with one derived from history. That helps most where demand is variable and the schedule is large enough that a human cannot hold it in their head.
It helps least in the opposite case. A ten-person team with a stable weekly pattern does not need software to work out its rota, and buying it will cost more than the errors it prevents.
The Cost Argument, Honestly
The saving comes from two places: overtime incurred because a shift was understaffed, and payroll paid to people with nothing to do because it was overstaffed. Both are measurable in your own data before you buy anything.
Pull twelve months of scheduled hours against actual demand. Total the overtime and estimate the idle hours. That number is the ceiling on what any forecasting tool can save you, and it is the only credible business case. Vendor averages tell you what happened at somebody else’s company with somebody else’s starting position.
The Best-Evidenced Result in This Field
There is one genuinely rigorous study on scheduling and business performance, and it is worth more than every vendor case study combined. The Stable Scheduling Study ran a randomized experiment at Gap Inc., conducted by researchers at UNC Kenan-Flagler, UC Hastings and the University of Chicago: a three-store pretest from March to October 2015, then a 28-store pilot from November 2015 to August 2016 across the San Francisco and Chicago metropolitan areas.
The result was a median 7% increase in sales and a 5% increase in labor productivity in stores that gave workers more stable, predictable schedules.
An earlier version of this article reported that as a “7% jump in customer satisfaction in Gap’s UK and Europe stores” achieved through advanced forecasting tools. Every part of that was wrong: it was sales, not customer satisfaction; the US, not Europe; and the intervention was schedule stability and predictability, not a forecasting product. The correction matters, because the study’s actual finding cuts against how this software is usually sold. As the researchers put it, fluctuating customer demand is not the primary source of scheduling instability. A tool that optimizes labour to demand more aggressively can make schedules less stable, which is the opposite of what produced the gain.
How to Set Up Forecasting Software
Check Needs and Set Goals
Decide what you are optimizing for before you shortlist anything. Labour cost as a percentage of revenue, service level at peak, and schedule stability pull in different directions, and no configuration satisfies all three.
Then identify what actually drives your demand: historical sales, day of week, weather, local events, promotions. If you cannot name the drivers, the software cannot model them.
Prepare Data and Install
Collect at least a year of demand data – sales, transactions, traffic – at the granularity you schedule at. Hourly data is the usual requirement. Daily totals will not produce hourly schedules.
Audit your workforce data too: skills, availability, certifications, pay rates. This is normally where the effort goes, because most companies discover their availability records are years out of date.
Some organizations supplement this with structured assessment methods, such as an adaptive computerized testing solution, to evaluate workforce skills rather than relying on self-reported data.
Then choose software that fits your systems and your scale. Cloud deployment removes the installation problem but not the integration problem.
Test and Fine-tune
Backtest before you trust it. Generate forecasts for a period that has already happened and compare them with what occurred. Do this for a busy period, a quiet period, and a holiday, because the failures cluster at the extremes.
Investigate the large misses individually. Most trace to an event the model had no way of knowing about, which tells you what to add as an input.
Involve the managers who currently build schedules. They know about the recurring local events, the regular large orders, and the staff constraints that appear nowhere in your data. Skipping this step is how forecasting projects lose the people who have to use the output.
Getting More from Advanced Features
Using Live Data
Live demand data lets you adjust staffing intraday rather than only between schedules. This is valuable where you can genuinely call someone in or send someone home, and near-worthless where you cannot.
Be careful here. Sending staff home when demand drops is exactly the practice the Gap study found to be damaging, and several jurisdictions now regulate it through predictive scheduling laws that require advance notice and pay for cancelled shifts. Check your local rules before configuring anything that shortens shifts at short notice.
On what AI forecasting delivers, McKinsey’s operations research reports that applying AI-driven forecasting to supply chain management can reduce errors by between 20 and 50 percent, with associated reductions in warehousing and administration costs. This article previously reported that range as 30 to 50 percent; the source says 20 to 50, and it is about supply chain forecasting rather than labour scheduling specifically.
Basic vs Advanced Tools
| Feature | Basic Tools | Advanced Tools |
|---|---|---|
| Forecasting | Historical averages | Machine learning across multiple drivers |
| Data Sources | Sales history only | Sales, weather, events, promotions |
| Scheduling | Manual adjustment | Auto-generated against constraints |
| Real-time Updates | None | Continuous |
| Compliance | Manual checking | Rules engine for break and notice requirements |
The compliance row is often the strongest reason to buy at the higher tier, and it rarely appears in the sales pitch. Predictive scheduling ordinances vary by city and carry per-violation penalties, and a rules engine that blocks a non-compliant schedule is worth more than a marginally better forecast.
Tips for Long-term Success
Check and Update Data
Forecasting quality tracks data quality directly, and data decays. New locations, changed opening hours, discontinued product lines and departed staff all degrade a model quietly.
- Audit periodically for duplicates, gaps, and stale records.
- Update the model inputs when the business changes, not a quarter later.
- Reconcile scheduled hours against actual hours worked. Persistent gaps mean your labour standards are wrong.
On what bad data costs, Gartner’s estimate is worth citing properly: poor data quality costs organizations $12.9 million a year on average. That is an average across organizations of every size and every kind of data problem, so treat it as an argument for the discipline rather than a forecast of your own exposure.
Make Regular Improvements
Compare forecasts to outcomes on a fixed schedule and track forecast error as a metric in its own right. If nobody owns that number, it drifts.
The economist Edgar R. Fiedler’s advice holds here: “If you have to forecast, forecast often.” Frequent forecasting produces frequent feedback, which is the only thing that improves a model.
Keep training people. Turnover among the managers who operate the system is the most common reason a working implementation degrades within two years.
Fixing Common Problems
Data Quality Issues
Run periodic audits for duplicates, inconsistent formats, and records that are no longer true. Automate data capture where you can, since every manual re-entry is an opportunity for error.
We removed two examples from this section – a claim about Walmart reducing scheduling errors by 30% through automated data entry, and an unnamed retailer cleaning 25 million records in three months with a specific tool. Neither could be traced to a source.
Getting Staff on Board
A forecasting system that produces schedules people resent will be worked around. Managers will override it, staff will swap shifts off-system, and within a year your data will be worse than before.
Show people what it does for them. Published schedules further in advance, fewer last-minute changes, and a working shift-swap mechanism are benefits staff actually feel. The Gap study is the evidence that this is not merely a soft consideration: stability improved sales.
Train in more than one format, and involve the people who build schedules today in configuration. They will tell you which constraints are real.
Quick Fix Guide
| Issue | Likely cause |
|---|---|
| Forecasts consistently high or low | Labour standards wrong, or a demand driver missing from the model |
| Forecasts fine except at peaks | Not enough history covering comparable peaks |
| Managers overriding every schedule | A real constraint the system does not know about |
| Staff working around the system | Schedules published too late, or swaps too hard |
| Accuracy degrading over time | Stale availability and skills data |
Conclusion
Labor forecasting software earns its cost where demand is variable, the workforce is large enough that manual scheduling is genuinely hard, and you have clean hourly history to feed it. Outside those conditions it is an expensive way to produce the schedule you already had.
The honest summary of the evidence: McKinsey puts AI forecasting error reduction in supply chain contexts at 20 to 50 percent. The Gap experiment found a median 7% sales gain and 5% productivity gain from more stable schedules. Gartner puts the average annual cost of poor data quality at $12.9 million. Everything else quoted in this field – the ROI multiples, the accuracy percentages, the anonymous companies cutting six figures of overtime – comes from vendor marketing and should be treated accordingly.
Before you buy, calculate your own overtime and idle-hours figure from twelve months of data. That number, not anyone’s benchmark, tells you what this is worth to you.
More on this topic
Browse all 52 articles on HR & People Ops.