

Power BI and Tableau are two leading data visualization tools used in finance. Here’s a quick comparison.
Pricing
Both vendors have restructured their licensing since this article was written, and none of the prices it previously carried are still correct. Everything below was read off Microsoft’s and Tableau’s own pricing pages in August 2026. Confirm before you budget.
| Tool | Free Version | Paid Licences |
|---|---|---|
| Power BI | Free account; Power BI Desktop is free to download | Pro: $14.00 per user/month, paid yearly. Premium Per User: $24.00 per user/month, paid yearly. Capacity is now bought as Microsoft Fabric capacity (reserved or pay-as-you-go). |
| Tableau | Free trial available | Tableau Standard: from $15 per user/month, billed annually. Tableau Enterprise: from $35 per user/month, billed annually. Tableau Next: from $40. Cloud+ and Server+ on request. All Tableau products require an annual contract. |
Two corrections worth calling out. Power BI Pro is $14 per user per month, not the $9.99 this article previously listed. And Power BI Premium per capacity at $4,995 a month no longer exists as a product — Microsoft has folded that capacity model into Microsoft Fabric, so if you are budgeting from an old quote, that line item has changed shape entirely. On the Tableau side, the Creator, Explorer and Viewer tiers this article named are no longer how Tableau sells to teams and organisations; it now leads with Standard, Enterprise and Next.
Key Strengths
| Strength | Power BI | Tableau |
|---|---|---|
| Data Visualization | Standard charts and dashboards, plus a marketplace of custom visuals | Advanced interactive dashboards and custom visuals |
| Data Handling | Strong data transformation tools (Power Query) | Strong data blending, plus Tableau Prep for transformation |
| Integration | Tightest integration with the Microsoft stack | Connects to a very wide range of data sources |
| User Experience | Intuitive, user-friendly interface | More advanced, steeper learning curve |
Recommendations
- For small to medium businesses: Power BI is cheaper per seat and integrates well with Microsoft products.
- For large enterprises: Tableau is generally stronger on very large datasets and advanced analytics.
- For cross-platform needs: Tableau Desktop runs on Windows and macOS; Power BI Desktop is Windows-only, though the Power BI service runs in any browser.
- For advanced visualizations: Tableau provides more flexibility and customization options.
Choose the tool that best aligns with your organization’s size, budget, existing technology stack, and specific data visualization requirements.
Background Information
Origins and Development
Power BI was launched by Microsoft in 2015 as a tool for business intelligence and data visualization. It evolved from earlier Microsoft products like Excel and SQL Server Reporting Services. Over time, Power BI gained popularity because of its close integration with other Microsoft products and its user-friendly interface.
Tableau was founded in 2003 and quickly became a leader in data visualization and analytics. It pioneered visual analytics and drag-and-drop data exploration. It is now owned by Salesforce.
Power BI Key Features
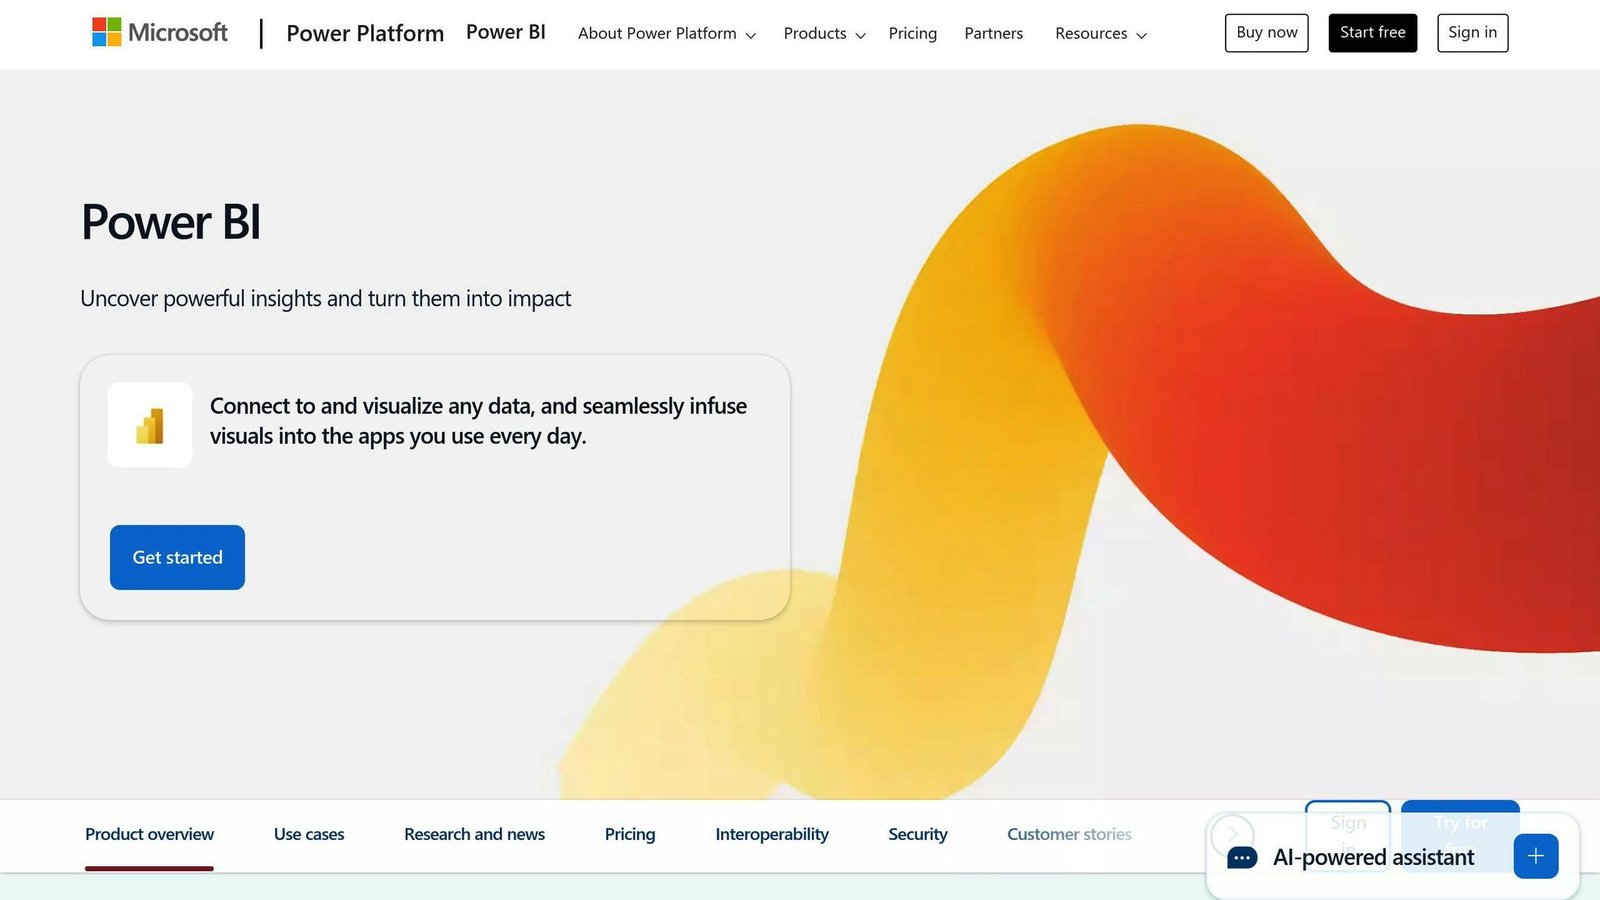
Some key features of Power BI for financial data visualization include:
- Microsoft Integration: Power BI integrates closely with Excel, SharePoint, and SQL Server, making it a natural choice for organizations already in Microsoft’s ecosystem.
- User-Friendly Interface: Power BI offers an intuitive interface with drag-and-drop functionality, making it easier for non-technical users to create visualizations and dashboards.
- Data Transformation: Power Query gives Power BI genuinely strong data transformation and cleaning tools, letting users shape data before analysis.
Tableau Key Features

Tableau’s key features for financial data visualization include:
- Advanced Visualizations: Tableau is known for its visualization range, with many chart types and highly interactive dashboards.
- Data Flexibility: Tableau connects to a wide range of data sources, including databases, spreadsheets, and cloud services.
- Data Blending: Tableau lets users combine data from multiple sources without loading it all into one model first.
Data Visualization in Finance
Data visualization plays a crucial role in the financial sector, enabling organizations to make informed decisions based on data-driven insights. Financial data is often complex, making it challenging to identify patterns and trends through traditional reporting methods. Data visualization tools like Power BI and Tableau help transform raw data into visual representations, allowing users to quickly identify trends, outliers, and correlations.
Effective data visualization in finance can provide several benefits, including:
| Benefit | Description |
|---|---|
| Improved Decision-Making | By presenting financial data clearly and intuitively, data visualization tools enable stakeholders to make better-informed decisions based on insights derived from the data. |
| Enhanced Data Exploration | Interactive visualizations and dashboards allow users to explore financial data from multiple perspectives, uncovering hidden insights and patterns. |
| Effective Communication | Well-designed visualizations can effectively communicate complex financial information to various stakeholders, facilitating better understanding and collaboration. |
| Trend Analysis | Visualizations like line charts and sparklines make it easier to identify and analyze trends in financial data, enabling more accurate forecasting and planning. |
Comparison Criteria
When choosing between Power BI and Tableau for financial data visualization, consider these key factors:
Data Visualization Options
Power BI covers the standard chart types comfortably and has a marketplace of custom visuals on top. Tableau offers a wider range out of the box and more control over the result. The gap is narrower than it was, but it is still real at the complex end.
Handling Financial Data
Power BI’s Power Query is the stronger tool for transforming and cleaning financial data before it reaches a report. Tableau is better at blending data from several sources at query time, and offers Tableau Prep for transformation work.
Data Integration
Power BI integrates most tightly with Microsoft products like Excel and SQL Server. Tableau connects to those too, along with a broader set of databases, files and cloud services.
User Interface and Ease of Use
Power BI has an intuitive interface with drag-and-drop functionality, making it accessible for non-technical users. Tableau is more powerful but has a steeper learning curve.
Pricing and Licensing
Power BI: free account, Pro at $14.00 per user per month paid yearly, and Premium Per User at $24.00 per user per month paid yearly. Capacity-based licensing is now bought as Microsoft Fabric capacity rather than as Power BI Premium per capacity.
Tableau: Standard from $15 per user per month and Enterprise from $35 per user per month, both billed annually, with Tableau Next from $40 and Cloud+ or Server+ quoted on request. Note that Tableau requires an annual contract on all products, so there is no true monthly option to compare against Power BI’s monthly-look pricing.
This article previously gave two different figures for the same Tableau tier in two different sections — $70 in one table and $75 in the text — which is a good sign neither had been checked. Both are gone.
Performance and Scalability
Both tools handle large financial datasets well. Tableau is generally the better bet for the largest datasets and most complex calculations.
Security and Compliance
Power BI inherits Microsoft Entra ID identity and Microsoft 365 governance, which is an advantage if you already run that stack. Tableau offers its own encryption, row-level security and access controls.
Community and Resources
Power BI’s community is geared towards Microsoft users, while Tableau’s community focuses on data visualization and analytics. Both offer tutorials, webinars, and customer support.
Detailed Comparison
Data Visualization Capabilities
Power BI and Tableau overlap more than most comparisons admit. Here is the corrected picture — the previous version of this table marked Power BI as lacking interactive dashboards and custom visuals, which is simply wrong: Power BI dashboards are interactive and it has had a custom visuals marketplace for years.
| Feature | Power BI | Tableau |
|---|---|---|
| Standard Visualizations | ✅ | ✅ |
| Advanced Visualizations | ✅ | ✅ (wider range) |
| Interactive Dashboards | ✅ | ✅ |
| Custom Visuals | ✅ (marketplace) | ✅ (extensions) |
Where they differ is at the top end. Tableau gives you more control over an unusual chart, and more people who know how to build one.
Financial Data Handling
Both tools transform and both blend; the difference is emphasis, not capability. The previous version of this table marked each tool as unable to do what the other specialises in, which overstated the gap in both directions.
| Feature | Power BI | Tableau |
|---|---|---|
| Data Transformation | ✅ (Power Query, stronger) | ✅ (Tableau Prep) |
| Data Blending | ✅ (model relationships) | ✅ (stronger at query time) |
| Financial Data Analysis | ✅ | ✅ |
Power BI is the better tool for getting messy financial data into shape. Tableau is the better tool for exploring data that lives in several places at once.
Financial Data Integration
Both connect widely. Again, the previous table marked absolutes that were not true — Tableau connects to SQL Server and Excel perfectly well.
| Feature | Power BI | Tableau |
|---|---|---|
| Microsoft Product Integration | ✅ (native) | ✅ (connectors) |
| Diverse Data Source Connectivity | ✅ | ✅ (wider) |
The Microsoft advantage for Power BI is not connectivity, it is everything around it: single sign-on, permissions, publishing into Teams, and the fact that your finance team already has the licence.
Pros and Cons
Power BI Pros and Cons
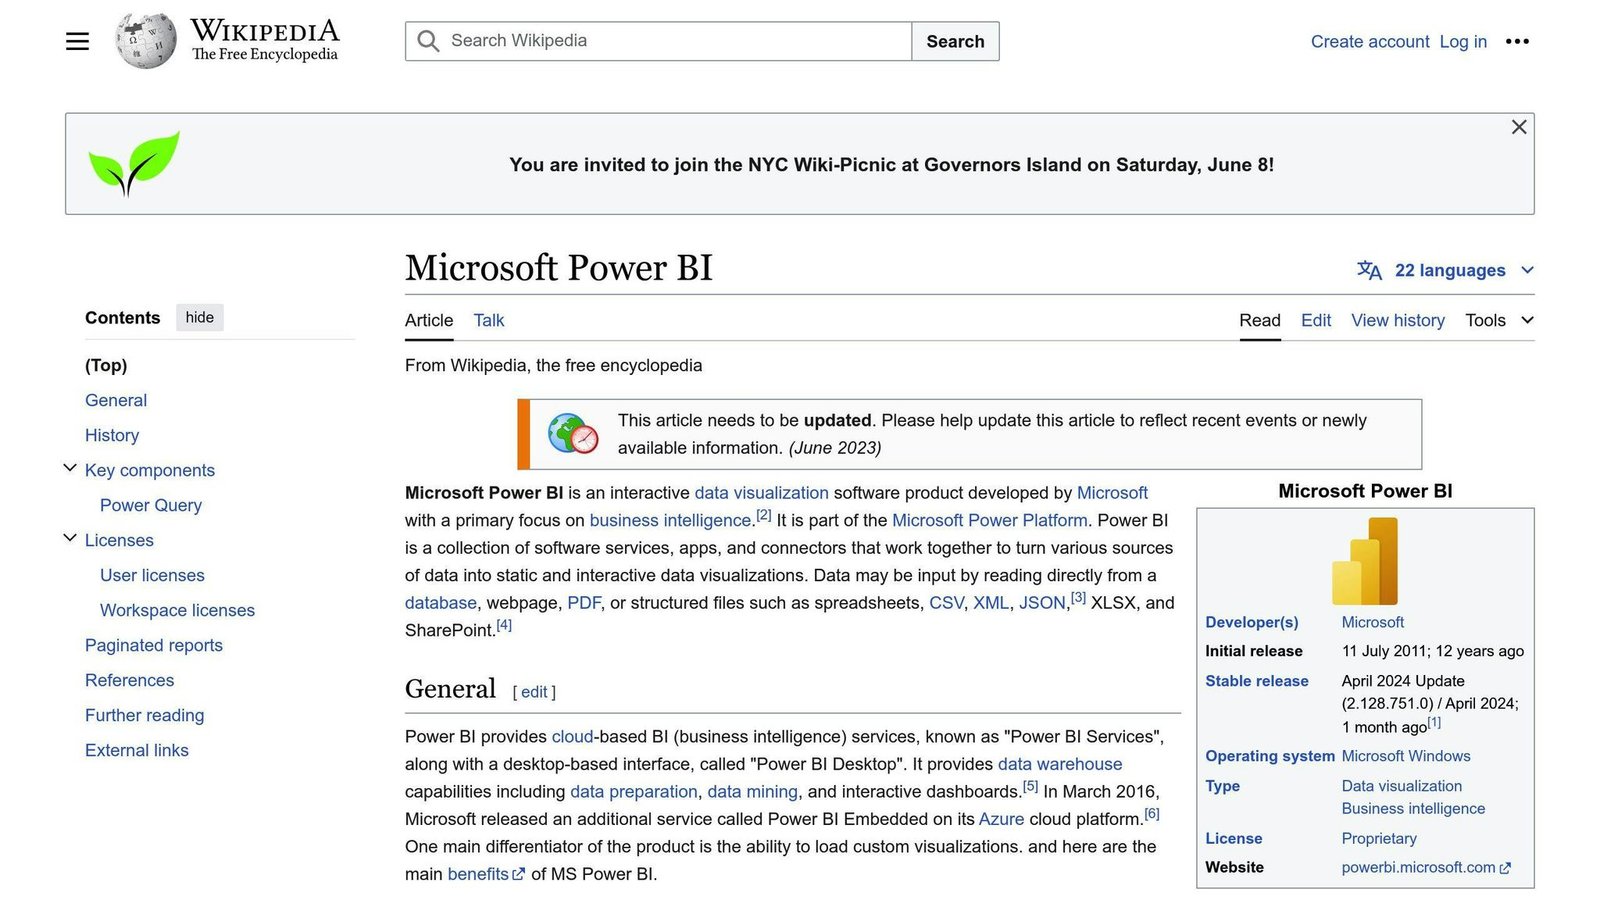
Power BI is a business analytics tool from Microsoft. Here are its key pros and cons:
Pros:
| Benefit | Description |
|---|---|
| Cost-effective | At $14 per user per month for Pro, Power BI is cheaper per seat than Tableau Enterprise and comparable to Tableau Standard. |
| Microsoft Integration | It integrates natively with Excel, Azure, and SQL Server, and inherits Microsoft 365 identity and governance. |
| User-friendly | Power BI is known for its intuitive interface, making it easy for beginners or non-technical users. |
| Data preparation | Power Query is a genuinely strong data preparation tool, and it is included. |
Cons:
| Limitation | Description |
|---|---|
| Desktop is Windows-only | Power BI Desktop does not run natively on macOS. The browser-based service does, but authors on Macs need a workaround. |
| Large Datasets | It can hit performance limits with extremely large datasets, and the fix is usually buying capacity. |
| Capacity licensing has changed | Capacity is now purchased as Microsoft Fabric capacity, which is a different budgeting exercise from the old Premium per-capacity model. |
Tableau Pros and Cons
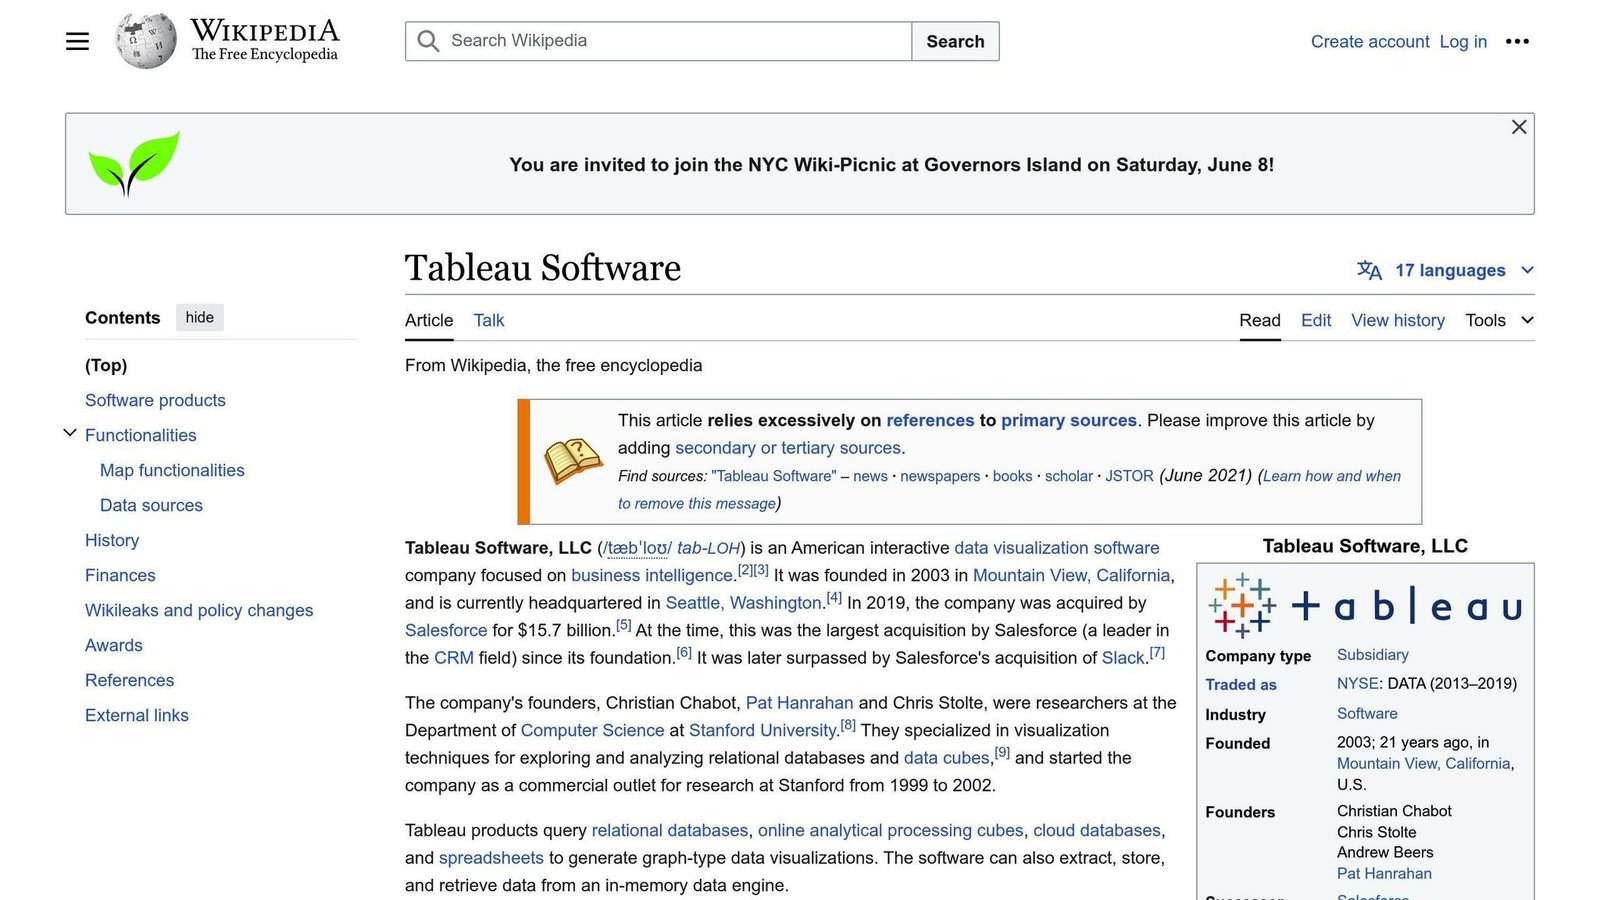
Tableau is a leading data visualization tool, now owned by Salesforce. Here are its key pros and cons:
Pros:
| Benefit | Description |
|---|---|
| Advanced Visualizations | It offers greater flexibility and more advanced options for data visualization and analytics. |
| Large Datasets | It tends to perform better than Power BI with very large datasets. |
| Cross-platform | Tableau Desktop runs on both Windows and macOS. |
| Community and Support | It has a large, active community and extensive support resources. |
Cons:
| Limitation | Description |
|---|---|
| Cost and contract | Tableau Enterprise is $35 per user per month against Power BI Pro’s $14, and every Tableau product requires an annual contract. |
| Learning Curve | It takes longer for beginners or non-technical users to become productive. |
| Microsoft Integration | It connects to Microsoft data sources, but it does not inherit Microsoft identity, permissions and publishing the way Power BI does. |
Recommendations and Conclusion
When choosing between Power BI and Tableau for financial data visualization, consider the following:
For Small to Medium Businesses
Power BI may be a better choice due to:
- Lower cost: $14 per user per month for Pro, and often already covered by an existing Microsoft agreement.
- Microsoft integration: It integrates natively with Excel and SQL Server.
- User-friendly: Power BI has an intuitive interface, making it easier for non-technical users.
For Large Enterprises
Tableau may be a better fit for large enterprises due to:
- Advanced visualizations: More flexibility and more advanced options.
- Large datasets: Generally better performance at scale.
- Depth of analytics: Stronger for complex analytical work.
Cross-Platform Needs
If your analysts work on Macs, Tableau Desktop runs there natively and Power BI Desktop does not. That single fact decides the question for some teams.
Advanced Analytics Requirements
If advanced analytics and complex visualization are central to the job, Tableau’s depth makes it the better choice.
| Consideration | Power BI | Tableau |
|---|---|---|
| Cost per seat | $14/user/month (Pro), paid yearly | From $15/user/month (Standard) or $35 (Enterprise), annual contract |
| Microsoft Integration | Native | Connectors, not native identity |
| User-Friendliness | Intuitive interface | Steeper learning curve |
| Advanced Visualizations | Good, with a custom visuals marketplace | Wider range and finer control |
| Large Datasets | Can hit limits without added capacity | Handles large datasets well |
| Cross-Platform authoring | Desktop is Windows only | Desktop on Windows and macOS |
| Advanced Analytics | Capable | Deeper |
Both are capable financial data visualization tools, and for most small and medium finance teams the deciding factor is which one your organisation already pays for. Check the current licence prices yourself before committing: both vendors changed them in the period this article was live.
FAQs
Which tool is better for data visualization: Tableau or Power BI?
It depends on your data volume and your existing stack. On performance:
| Consideration | Power BI | Tableau |
|---|---|---|
| Large Datasets | Can struggle with very large datasets | Handles large datasets well |
| Smaller Datasets | Fast | Comparable |
In general, Tableau copes better with very large data sets, while Power BI is quick and cheap on more limited data.
Should I use Power BI or Tableau?
If your organisation runs on Microsoft 365 and your finance team lives in Excel, Power BI is the lower-friction and lower-cost answer. If your analysts work on Macs, need the widest visualization range, or are handling very large datasets, Tableau earns its higher price. Price both at your actual seat count, remembering that Tableau requires an annual contract.
What’s the main difference between Power BI and Tableau?
The primary difference lies in their strengths:
- Power BI integrates more tightly with Microsoft products, costs less per seat, and has the stronger built-in data preparation tool.
- Tableau handles larger datasets better, offers a wider visualization range, and runs natively on macOS as well as Windows.
Note the correction: this FAQ previously said Power BI was the better tool for large datasets, which contradicted the rest of the article. Tableau is the stronger option there.
More on this topic
Browse all 53 articles on Data & Analytics.