Understanding customer behavior is crucial for e-commerce success. Here are the ten metrics covered in this article:
- Add-to-Cart vs. Purchase Rate: Separates interest in the product from friction at checkout.
- Search History and Refinement: Shows what customers came looking for, in their own words.
- Click-Through Rate: Measures whether your ads and links earn the click.
- Conversion Rate: Tracks visitors who complete a desired action.
- Average Order Value: The average amount spent per order.
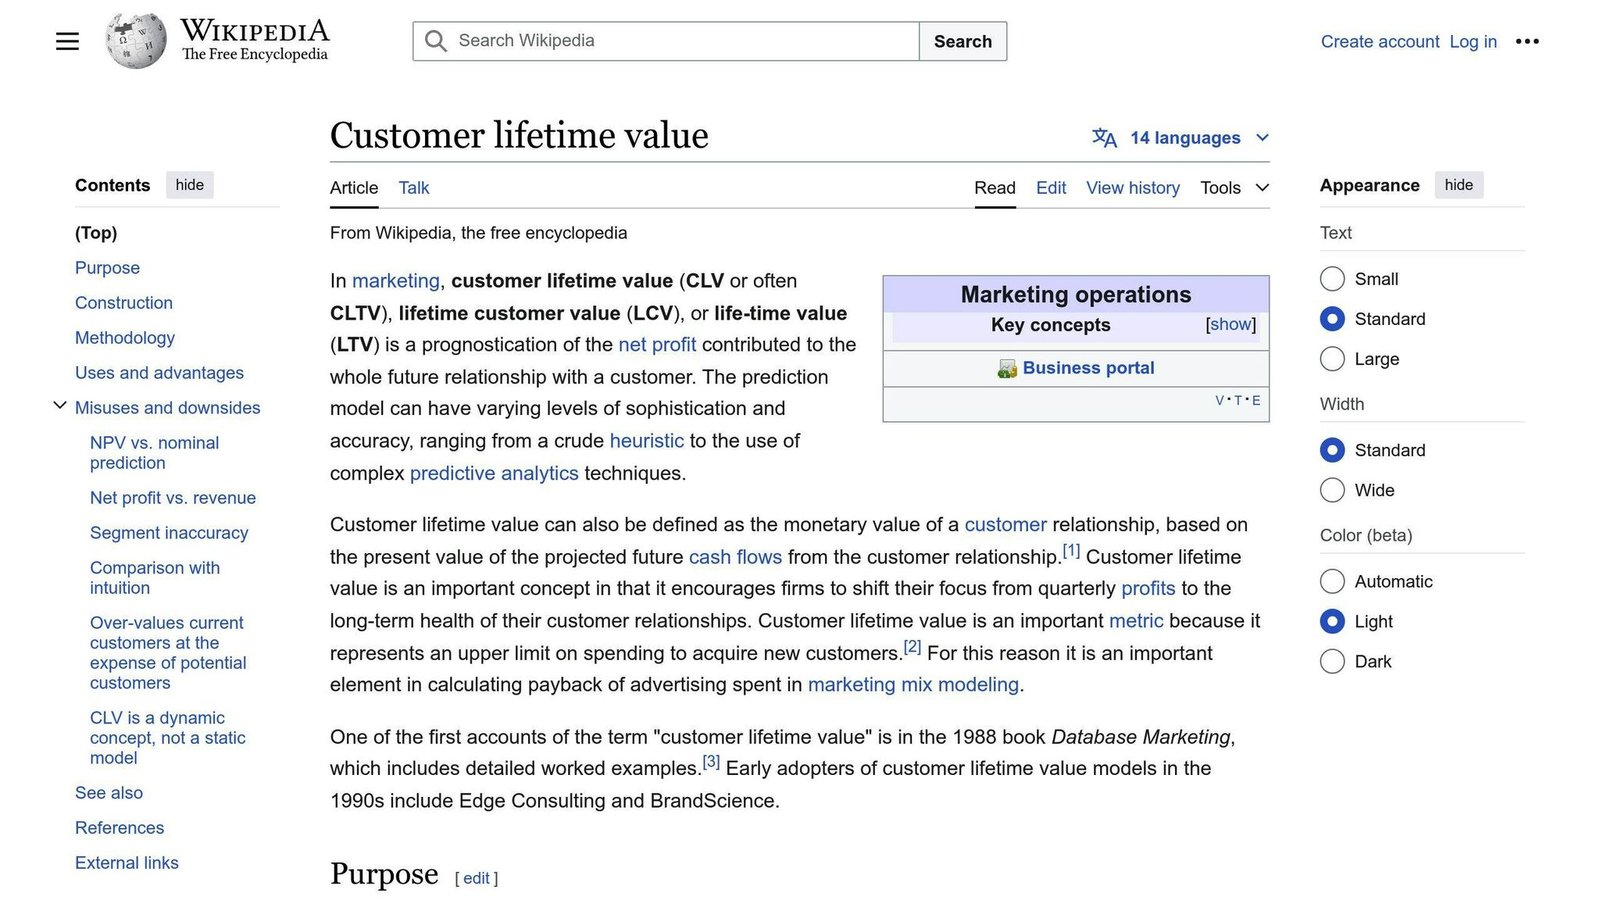
- Customer Lifetime Value: The projected revenue a customer generates over time.
- Cart Abandonment Rate: Customers who add items but do not buy.
- Product Return Rate: The share of orders that come back.
- Customer Engagement Metrics: How customers interact with your brand.
- Customer Satisfaction and Loyalty: CSAT, NPS, retention and effort scores.
None of these are worth tracking for their own sake. Track a metric when you can name the decision it would change. If nobody would act differently on the number, it is a report, not a metric.
Quick Comparison
| Metric | What It Measures | Why It’s Important |
|---|---|---|
| Add-to-Cart vs. Purchase Rate | Interest versus completed purchases | Separates a product page problem from a checkout problem |
| Search History and Refinement | What visitors type into site search | Reveals demand and catalogue gaps |
| Click-Through Rate | Clicks as a share of impressions | Shows whether ads and links are relevant |
| Conversion Rate | Visitors who complete desired actions | Measures ability to persuade visitors |
| Average Order Value | Average amount spent per order | Identify upselling opportunities |
| Customer Lifetime Value | Projected revenue from a customer | Guide customer retention strategies |
| Cart Abandonment Rate | Customers who add items but don’t purchase | Address barriers in the checkout |
| Product Return Rate | Share of orders returned | Signals product quality or description problems |
| Customer Engagement Metrics | Visitor interactions and interest levels | Gauge customer engagement |
| Customer Satisfaction and Loyalty | CSAT, NPS, retention, effort | Identify areas for improvement |
A note on tooling
Most of this article refers to Google Analytics as the default free option. If you are working from older instructions, note that Universal Analytics stopped processing data in July 2023 and Google Analytics 4 works quite differently: it is event-based rather than session-based, and several metrics that used to be a checkbox now have to be configured as events. Where a metric is not available out of the box in GA4, we say so below rather than implying it is.
1. Add-to-Cart vs. Purchase Rate
| Metric | What It Measures | Importance |
|---|---|---|
| Add-to-Cart Rate | Percentage of visitors who add at least one item to their shopping cart | Shows how well your product pages, recommendations, and calls-to-action perform in getting customers interested. |
| Purchase Rate | Percentage of customers who complete a purchase after adding items to their cart | Reveals how effective your checkout process, payment options, and shipping policies are at converting interested customers into buyers. |
These come from the standard e-commerce events (add_to_cart and purchase) that GA4 and most commerce platforms send once e-commerce tracking is configured.
A high add-to-cart rate with a low purchase rate points at the checkout: friction, surprise shipping costs, or missing trust signals. A low add-to-cart rate with a high purchase rate points at the product pages instead. This split is the single most useful diagnostic on the list, because it tells you which half of the funnel to spend money on.
Cost of tracking is effectively zero if you already run an analytics tool, since these are standard events.
2. Search History and Refinement
Why It Matters
What customers type into your site search is the closest thing you get to them telling you what they want. Analyzing search queries reveals popular products, categories, and gaps, which helps you fix your catalogue, your search, and your product naming.
Searches that return nothing are the most valuable report here. Each one is a customer who wanted to buy something and could not find it.
Implementation
GA4 captures site search through the view_search_results event, which enhanced measurement collects automatically for most setups. Search refinement (filters and sorting) usually needs custom events, so budget a little developer time for that part.
Understanding the Data
Look for:
- Common search terms used by customers
- Popular product categories and filters
- Searches that return no results
- Patterns in how customers refine their searches
Combining with Other Metrics
Pair search data with add-to-cart and purchase rates. A term that gets searched often and converts rarely is either a catalogue gap or a naming problem.
| Metric | Description | Importance |
|---|---|---|
| Search Terms | The keywords and phrases customers use to search for products | Identifies demand, popular categories, and trends |
| Refinement Actions | How customers narrow down results (filters, sorting) | Reveals preferences and gaps in search functionality |
3. Click-Through Rate (CTR)
Click-Through Rate measures how often people click your ads or links after seeing them. A high CTR means the ad is landing with the audience you are showing it to.
Why It Matters
CTR tells you whether your ads are relevant to the people seeing them. It does not tell you whether those people buy, which is why it should never be optimized on its own.
Where to Track It
CTR comes from the ad platform (Google Ads, Meta Ads) or from Google Search Console for organic results, not from Google Analytics itself. GA4 reports on what happens after the click.
Understanding the Data
A rising CTR with a falling conversion rate usually means your ad is promising something the landing page does not deliver. That combination is worth more attention than either number alone.
Use CTR to identify:
- Whether you are targeting the right audience
- Whether the ad copy matches the landing page
| Metric | What It Shows | Why It’s Important |
|---|---|---|
| Click-Through Rate | The percentage of people who click your ads or links | Measures how relevant your ads are to the audience |
| Ad Targeting | Selecting the right audience for your ads | Drives both CTR and downstream conversion |
| Ad Copy Optimization | Refining ad text to match the offer | Raises CTR without hurting conversion |
4. Conversion Rate
What It Means
Conversion rate is the percentage of visitors who take a desired action, such as making a purchase or signing up for a newsletter. A low rate may point to user experience, product, or pricing problems.
How to Track It
In GA4 you mark the relevant events as key events (formerly called conversions) and the tool reports the rate against sessions or users. Decide up front which denominator you are using, because session-based and user-based conversion rates are different numbers and mixing them is a common reporting error.
Understanding the Data
Conversion rate is nearly meaningless without a segment. A blended site-wide figure hides the fact that returning customers on desktop convert at a completely different rate from first-time mobile visitors from paid social. Segment before you draw conclusions.
Combining with Other Metrics
Conversion rate works with click-through rate, add-to-cart rate, and average order value. Revenue is roughly traffic multiplied by conversion rate multiplied by average order value, so improving any one of the three moves the result.
| Metric | What It Shows | Why It Matters |
|---|---|---|
| Conversion Rate | Percentage of visitors who take a desired action | Measures how well your site persuades visitors to act |
| Goal Value | The value of each conversion | Shows the revenue impact of conversions |
| Conversion Rate Optimization | The process of improving conversion rates | Usually cheaper than buying more traffic |
5. Average Order Value (AOV)
What It Means
Average Order Value tracks the average amount a customer spends per order. It is calculated by dividing total revenue by the total number of orders.
How to Calculate It
Total Revenue / Total Number of Orders = AOV
How to Track It
GA4 reports average purchase revenue once e-commerce purchase events are sending revenue values correctly. Your commerce platform will also report it, and the two often disagree because they treat tax, shipping, discounts and refunds differently. Pick one as the source of truth and note which it is.
Understanding the Data
A rising AOV is usually good, but check what is driving it. AOV rises when you discount less, when you bundle, and also when your cheapest customers stop buying, which is not good news.
The mean is also easily distorted by a few large orders. If your order sizes vary a lot, look at the median alongside the average.
Combining with Other Metrics
| Metric | What It Shows |
|---|---|
| Conversion Rate | Percentage of visitors who make a purchase |
| Customer Lifetime Value (CLV) | Total value a customer brings over time |
6. Customer Lifetime Value (CLV)
What It Means
Customer Lifetime Value is the total revenue a customer brings over their relationship with you. It is the number that tells you how much you can afford to spend acquiring one.
How to Calculate It
A common approximation is: Average Order Value x Purchase Frequency x Customer Lifespan
Treat that as a rough estimate. It uses revenue rather than margin, so it overstates what a customer is actually worth, and it assumes past behaviour continues. For acquisition decisions, use gross margin rather than revenue.
How to Track It
GA4 includes a lifetime value report for users it can identify, but it only sees the window it has been collecting for and it cannot see orders taken outside your website. For most businesses the reliable CLV calculation comes from the commerce or CRM database, not from web analytics.
Combining with Other Metrics
CLV means little without acquisition cost beside it. The ratio of the two is the number that decides whether growth is profitable.
| Metric | What It Shows |
|---|---|
| Average Order Value (AOV) | The average amount a customer spends per order |
| Customer Acquisition Cost | What it costs to win one new customer |
7. Cart Abandonment Rate
What It Means
Cart Abandonment Rate is the percentage of customers who add items to their cart but do not complete the purchase.
How to Track It
Be aware that this is not a built-in metric in GA4. There is no cart abandonment rate report to switch on. You derive it by comparing add_to_cart or begin_checkout events against purchase events, usually in a funnel exploration. Many commerce platforms report it directly, and their definition may differ from yours, so check which events theirs is based on before comparing figures.
Understanding the Data
Abandonment rates in e-commerce are high across the board, and a large share of it is ordinary browsing behaviour rather than a broken checkout. Do not chase the absolute number. Watch your own trend, and watch which step people leave at.
Reducing It
| Strategy | Description |
|---|---|
| Show costs early | Surprise shipping costs at the final step are a leading cause of abandonment |
| Guest Checkout | Allow customers to check out without creating an account |
| Simplify Checkout | Remove fields and steps that are not needed to take the order |
| Clear Product Info | Provide detailed product information and reviews |
| Abandoned Cart Emails | Send reminders about unfinished purchases, within the consent you hold |
8. Product Return Rate
What It Measures
Product Return Rate is the percentage of orders that customers send back. It reflects product quality, sizing accuracy, and how honest your product descriptions are.
Where the Data Comes From
This one comes from your order management or commerce platform, not from web analytics. Web analytics sees the purchase and never sees the parcel come back.
Understanding the Data
Look at it by product and category rather than site-wide. A site-wide return rate averages away the specific products causing the problem, which are usually a small number of lines with a sizing or description issue.
Combining with Other Metrics
Returns should be netted off revenue before you calculate AOV or CLV. A high-AOV customer who returns most of what they order is not a valuable customer, and a lot of e-commerce reporting quietly gets this wrong.
| Metric | What It Shows | Why It Matters |
|---|---|---|
| Product Return Rate | Percentage of orders returned by customers | Indicates product quality and description accuracy |
| Customer Feedback | Comments and ratings from customers | Explains why the returns are happening |
| Product Quality Data | Information on defects, sizing, and so on | Pinpoints products or categories driving returns |
9. Customer Engagement Metrics
Customer engagement metrics show how customers interact with your brand, products, or services.
Why It Matters
Engagement data gives context to the transaction data. On its own it rarely justifies a decision, which is why it belongs near the bottom of this list rather than the top.
How to Track It
GA4 measures engaged sessions and engagement rate out of the box. Satisfaction and loyalty scores come from surveys, not analytics, and need a separate tool or a simple post-purchase email.
Understanding the Data
Be careful reading engagement as approval. Time on site goes up when people cannot find what they want, and page views per session rise when navigation is confusing. Always read engagement metrics next to a conversion metric.
Combining with Other Metrics
| Metric | What It Shows |
|---|---|
| Conversion Rates | Percentage of visitors who make a purchase |
| Average Order Value | Average amount spent per order |
| Customer Lifetime Value | Total value a customer brings over time |
Key Customer Engagement Metrics
| Metric | What It Measures | Why It Matters |
|---|---|---|
| Customer Satisfaction (CSAT) | Customer happiness with products or services | Early signal on retention |
| Net Promoter Score (NPS) | Likelihood to recommend | Widely used, easy to compare across periods |
| Customer Effort Score (CES) | Ease of customer interactions | Often predicts churn better than satisfaction does |
| Social Media Engagement | Customer interactions on social platforms | Brand awareness, weakly linked to revenue |
| Customer Retention Rate | Percentage of customers retained over time | The metric that actually drives CLV |
10. Customer Satisfaction and Loyalty Metrics
These metrics tell you how happy customers are and how likely they are to come back.
Why It Matters
Understanding satisfaction and loyalty helps businesses:
- Identify where the customer experience breaks down
- Increase retention and reduce churn
- Grow revenue through repeat purchases
How to Collect It
Through surveys and feedback forms, not through web analytics. Keep the survey short and send it close to the event you are asking about.
Understanding the Data
Survey metrics carry heavy response bias: the people who answer are disproportionately the delighted and the furious. Retention rate, which is measured from behaviour rather than opinion, is the more trustworthy loyalty number.
Key Metrics
| Metric | What It Measures | Why It’s Important |
|---|---|---|
| Customer Satisfaction (CSAT) | How happy customers are with your products or services | Quick read on a specific interaction |
| Net Promoter Score (NPS) | How likely customers are to recommend your brand | Comparable over time and across teams |
| Customer Retention Rate | Percentage of customers you keep over time | Behavioural, so harder to fool than a survey |
| Customer Lifetime Value (CLV) | Total revenue a customer generates over time | Sets your acquisition budget |
| Customer Effort Score (CES) | How easy it is to deal with your brand | Strong predictor of repeat purchase |
Pros and Cons
| Metric | Pros | Cons |
|---|---|---|
| Add-to-Cart vs. Purchase Rate | Isolates product page problems from checkout problems | Does not capture intent that never reaches the cart |
| Search History and Refinements | Direct statement of what customers want | Refinement tracking needs custom setup |
| Click-Through Rate | Easy to understand, available in every ad platform | Misleading on its own; clicks are not sales |
| Conversion Rate | Direct link to revenue | Meaningless unsegmented |
| Average Order Value | Simple to calculate | Distorted by outliers and by discount policy |
| Customer Lifetime Value | Sets the acquisition budget | Depends on assumptions that are easy to get wrong |
| Cart Abandonment Rate | Points at specific checkout steps | Not built into GA4; definitions vary by tool |
| Product Return Rate | Catches quality and description problems | Needs order data, not analytics data |
| Customer Engagement Metrics | Adds context to transaction data | High engagement can mean confusion |
| Customer Satisfaction and Loyalty | Direct customer feedback | Response bias; small samples |
Conclusion
Ten metrics is more than most e-commerce businesses need at once. If you are starting from nothing, get add-to-cart versus purchase rate working first. It tells you which half of your funnel is losing money, and everything else is easier to prioritise once you know that.
Then add conversion rate segmented by source and device, and average order value net of returns. Those three will support most of the decisions you actually face.
The survey-based metrics are worth adding once the transactional picture is solid, not before. And whatever you track, write down the definition you are using, because the same metric name means different things in your analytics tool and your commerce platform, and reconciling them later is painful.
FAQs
Which metric shows how well an e-commerce site works?
No single metric does. Customer lifetime value comes closest for the health of the business overall, but it is slow to move and slow to measure. For whether the site itself is working, conversion rate segmented by traffic source is the more practical answer.
How are customer insights tracked for e-commerce?
Through a combination of web analytics for on-site behaviour, your commerce platform for orders and returns, and surveys for opinion. No one tool covers all three, which is why the numbers rarely agree.
What is e-commerce data analytics?
Tracking and analyzing key performance indicators for an e-commerce business: lifetime value, acquisition cost, shopping behaviour, and search performance among others.
What e-commerce metrics should I track?
If you track only four:
| Metric | Description |
|---|---|
| Conversion Rate | Percentage of visitors who make a purchase, segmented by source |
| Average Order Value | Average amount spent per order, net of returns |
| Cart Abandonment Rate | Where in checkout customers drop out |
| Customer Lifetime Value | Total margin a customer generates, against acquisition cost |
How do I set up e-commerce analytics?
In Google Analytics 4 the outline is:
- Create a GA4 property and a web data stream for your site.
- Install the GA4 tag, usually through Google Tag Manager or your commerce platform’s built-in integration.
- Send the standard e-commerce events (
view_item,add_to_cart,begin_checkout,purchase) with item and revenue details. Most major platforms have a plugin or native setting that does this. - Mark the events that matter as key events so they appear as conversions.
- Verify with the DebugView and Realtime reports that revenue values are arriving and are not double-counted.
There is no longer a single “enable e-commerce” switch as there was in Universal Analytics. The work is in getting the events and their revenue values right, and that is worth checking carefully, because every metric above inherits any error you leave there.
More on this topic
Browse all 53 articles on Data & Analytics.

![E-commerce Personalization: Complete Guide [2024]](https://bizbot.com/wp-content/uploads/2026/08/662e9e5db17fd355c0be37e7-6b9799a37e5bf25bac30efcc2c0f1eed.png "E-commerce Personalization: Complete Guide [2026]")