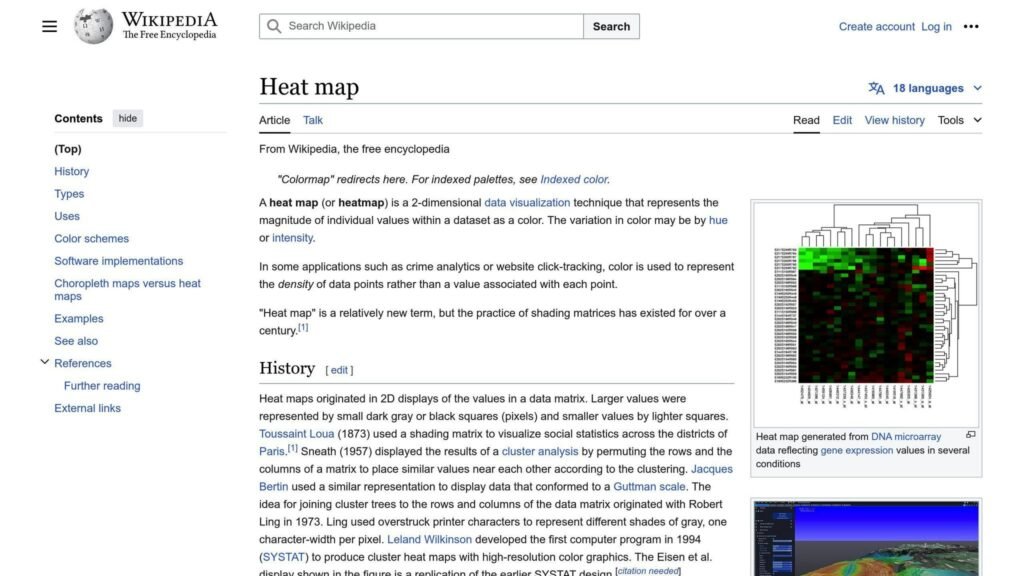
Heatmaps are visual tools that reveal how users interact with your website. By analyzing heatmap data, you can:
- Identify high and low engagement areas
- Detect user frustration and confusion
- Optimize for mobile devices
- Analyze user scrolling behavior
To improve your website’s user experience (UX), use heatmaps in the following ways:
| Heatmap Type | Purpose |
|---|---|
| Click Heatmaps | Show where users click most often on desktop and mobile sites. Place important elements like CTAs and navigation menus in high-engagement areas. |
| Mouse Movement Heatmaps | Highlight areas where users may struggle. Look for unresponsive gestures, rage clicks, confusing elements, and abandoned events. |
| Mobile Heatmaps | Reveal issues specific to smaller screens, like difficulty tapping small buttons or links. |
| Scroll Heatmaps | Show how far down users scroll on desktop and mobile. Identify the average fold and false bottoms. |
One caveat worth stating at the top: a heatmap tells you what happened, never why. It is a tool for generating hypotheses, not for confirming them. Every recommendation below assumes you will test the change rather than assume the heatmap proved your reading of it.
1. Understand Different Heatmap Types
Heatmaps come in various forms, each designed to reveal specific user behavior insights. Here’s a breakdown of the main types:
Click Heatmaps
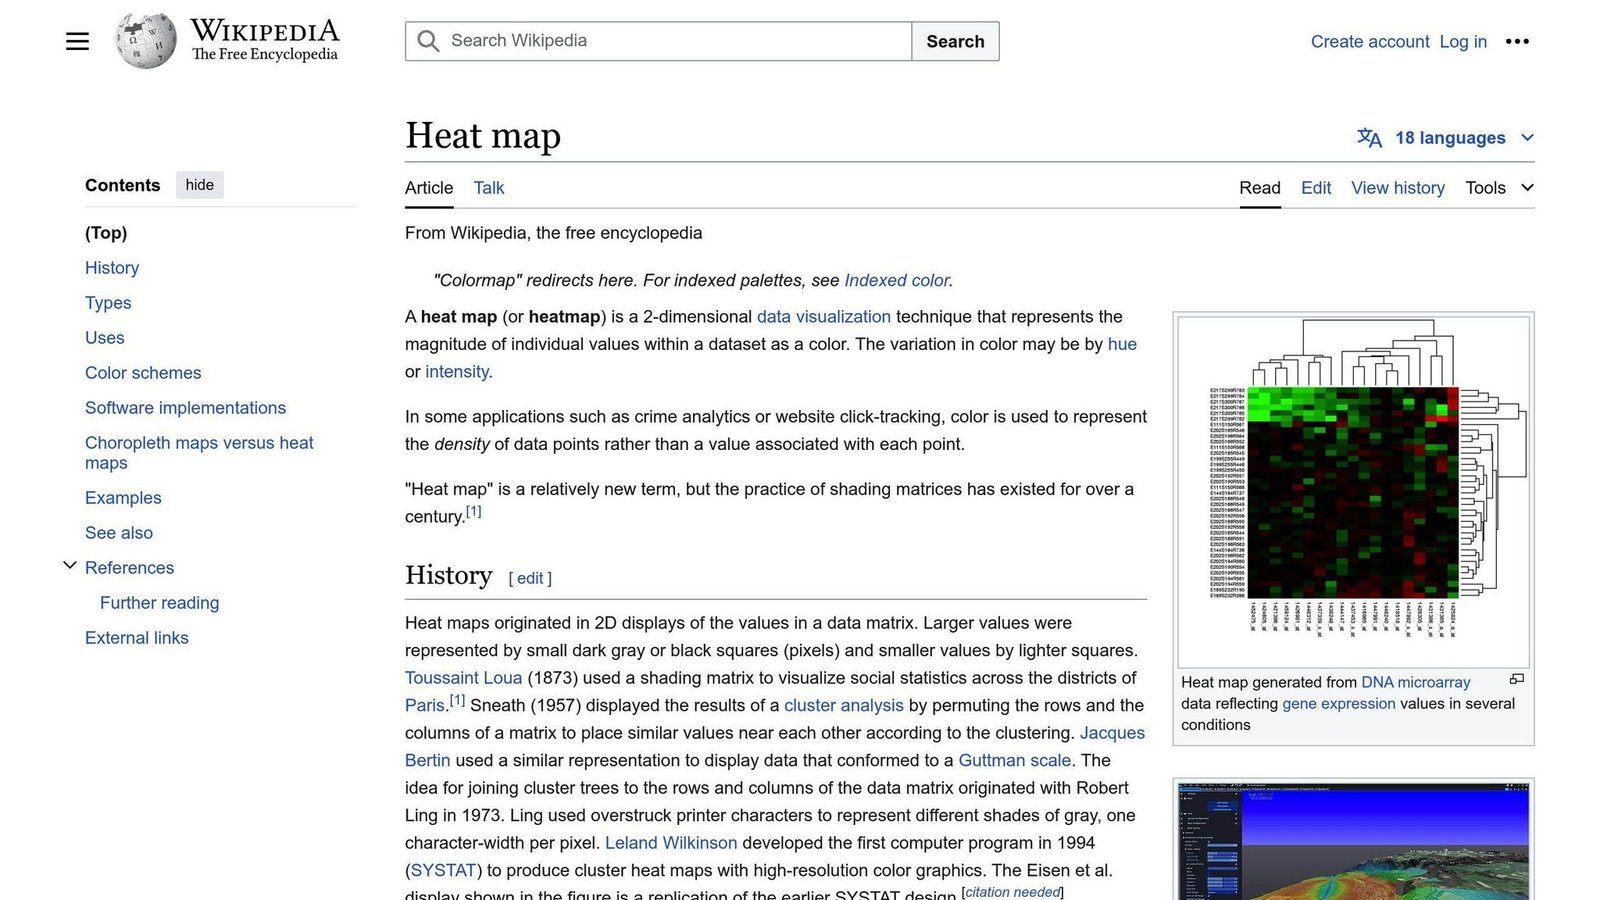
These show the most frequently clicked areas on a webpage, highlighting popular links, buttons, and menus. They also reveal overlooked sections that may need attention. Of all the types, this is the one whose data means what it appears to mean: a click is a deliberate action.
Scroll Heatmaps
Scroll heatmaps visualize how far down a page visitors scroll, indicating the “above the fold” area that gets the most views. This data helps optimize content placement.
Movement Heatmaps
Movement heatmaps track cursor movements to show which parts of a page the pointer passes over.
Treat these with more caution than the others. The link between where a cursor sits and where a person is looking is weak, and many people do not move the mouse while reading at all. Movement maps are worth using to generate questions, not to conclude that a section “is being read”.
Eye-Tracking Heatmaps
Eye-tracking heatmaps show where users actually focus on a page and in what order. These need either lab equipment or webcam-based tracking with the user’s explicit consent, which makes them far more expensive and slower to run than the other types. They are the only maps that genuinely measure attention.
Mobile Heatmaps
These are applied to mobile sites and apps, highlighting tap locations and swipes on smaller screens. This helps you understand how your mobile version performs compared to the desktop one, which is usually worse than teams expect.
| Heatmap Type | Purpose | Confidence in the data |
|---|---|---|
| Click Heatmaps | Identify popular and overlooked clickable elements | High |
| Scroll Heatmaps | Optimize content placement based on scroll depth | High |
| Movement Heatmaps | Suggest where attention may be going | Low |
| Eye-Tracking Heatmaps | Measure where users actually look | High, but costly to collect |
| Mobile Heatmaps | Analyze taps and swipes on mobile devices | High |
2. Find Areas of High User Activity
To improve your website’s user experience, you need to know where users are clicking, scrolling, and focusing their attention. Heatmaps reveal these hotspots, allowing you to:
- See which links, buttons, and menus get the most clicks
- Identify the content sections users spend time with
- Spot overlooked areas that need attention or changes
Here’s how to find these hotspots using heatmaps:
Click Heatmaps
Review click heatmaps to see the most frequently clicked areas on each page. Watch particularly for heavy clicking on things that are not links. That is not engagement, it is a design failure.
Scroll Heatmaps
Look at scroll heatmaps to understand how far down the page users scroll. This helps you place important content where users will see it.
Movement Heatmaps
Study movement heatmaps for hints about which areas draw the pointer, remembering the caveat above about how loosely that tracks attention.
| Heatmap Type | Purpose |
|---|---|
| Click Heatmaps | Find popular and overlooked clickable elements |
| Scroll Heatmaps | Optimize content placement based on scroll depth |
| Movement Heatmaps | Suggest possible areas of interest |
3. Analyze User Scroll Behavior
Scroll heatmaps show how far down the page users scroll. This data helps you place content in the right spots.
Identify Scroll Patterns
Scroll heatmaps reveal the percentage of users who reach each section. By analyzing these patterns, you can:
- Find where the majority of readers stop and place important content above it
- Spot where users lose interest and adjust your content
- Ensure critical elements like calls-to-action are visible without scrolling
Watch for false bottoms
A false bottom is a point where the layout looks like the end of the page, so people stop scrolling even though there is more below. A sharp cliff in a scroll map, at a place that is not the actual page end, usually means you have one. This is the single most actionable finding a scroll map produces.
Optimize Content Placement
- Put key information high on the page
- Break up long content into scannable sections
- Use clear headings and visuals to draw users further down
Improve User Experience
- Help users find what they need faster
- Place relevant content where people actually are
- Give the page a layout that does not fight the reader
4. Identify User Frustration and Confusion
Heatmaps can reveal areas where users struggle. Here’s how to detect frustration and confusion:
Unresponsive Gestures
Unresponsive gestures occur when users try to interact with an element but it doesn’t respond. Heatmaps show where these happen, indicating areas that need UI improvements.
Rage Clicks
Rapid, repeated clicks on one element usually signal frustration. This is the clearest frustration signal a heatmap gives you, and it is worth setting up an alert for rather than waiting to spot it in a monthly review.
Confusing Elements
Clicks on non-clickable elements indicate confusion: something looks like a button and is not. Either make it clickable or make it look inert.
Abandoned Events
Abandoned events occur when users start but don’t complete a process. Heatmaps show where users abandon, allowing you to reduce friction.
| Heatmap Insight | Potential Issue | Solution |
|---|---|---|
| Unresponsive Gestures | Unresponsive UI elements | Improve UI responsiveness |
| Rage Clicks | User frustration | Find what the user expected to happen and make it happen |
| Confusing Elements | Non-links that look like links | Change the affordance or make them work |
| Abandoned Events | Friction in user flow | Reduce friction and improve user flow |
5. Optimize for Mobile Devices
Most traffic to most sites is mobile, so a heatmap programme that only covers desktop is looking at the minority of your users.
Identify Mobile-Specific Issues
Mobile heatmaps reveal issues unique to mobile devices, such as:
- Difficulty tapping small buttons or links
- Navigation challenges due to screen size
- Tap targets too close together
Optimize Touchscreen Interactions
Mobile heatmaps show where users struggle with touch, such as:
- Accidentally tapping non-clickable elements
- Repeated taps due to unresponsive UI
One structural point: on mobile the fold sits far higher than on desktop, so content that is comfortably visible on a laptop may be three screens down on a phone. Check the two separately rather than assuming one map covers both.
Improve Mobile Conversion Rates
Heatmaps reveal where mobile users drop off, so you can address those sections specifically.
| Heatmap Insight | Potential Issue | Solution |
|---|---|---|
| Unresponsive Gestures | Unresponsive UI elements | Improve UI responsiveness |
| Rage Taps | User frustration | Fix the underlying interaction |
| Mis-taps | Tap targets too small or too close | Increase target size and spacing |
| Abandoned Events | Friction in user flow | Reduce friction and improve user flow |
6. Segment User Data
An unsegmented heatmap averages together people with completely different intentions, which is how you end up with a map that shows nothing clearly.
Identify User Segments
To segment your users, look at:
- Device type
- Behavior (new vs. returning, paid vs. free trial)
- Traffic source
- Goals (registration, purchase)
Analyze Segment-Specific Heatmaps
Create heatmaps for each segment to see how they differ. New visitors and returning customers use the same page very differently, and blending them hides both patterns.
Be aware of sample size. Segment far enough and you are looking at a handful of sessions, where a couple of unusual visitors can dominate the picture. Check how many sessions are behind a map before you act on it.
Personalize UX for Each Segment
With segment-specific insights, you can make targeted improvements. If new users consistently stall at one step, that is a case for a guided introduction rather than a redesign.
| User Segment | Potential Issue | Targeted Solution |
|---|---|---|
| New Users | Struggle with a feature | Tutorial or guided tour |
| Mobile Users | Difficulty tapping small buttons | Larger, better-spaced tap targets |
| Free Trial Users | Abandon during checkout | Reduce friction in checkout flow |
7. Combine Heatmaps with Other Analytics Tools
Heatmaps on their own answer very little. Their value comes from pairing them with tools that supply the missing context.
Test Changes with Heatmaps and A/B Testing
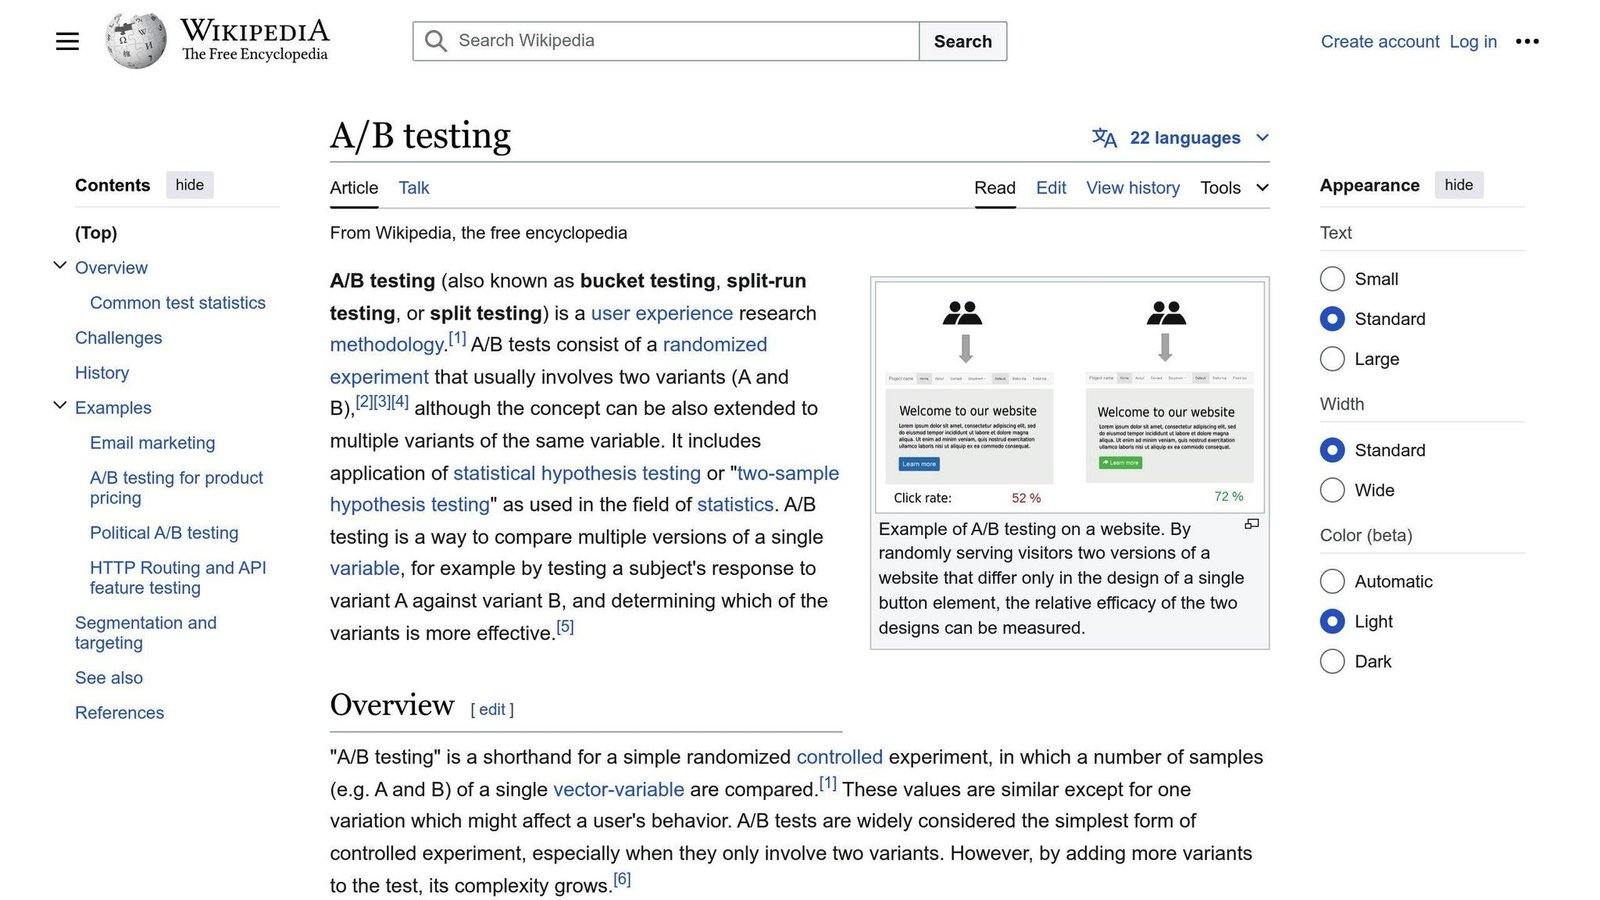
A/B testing is how you find out whether your reading of a heatmap was right. The cycle:
- Use heatmaps to spot a candidate issue
- Form a specific hypothesis about the cause
- Build the A/B test variations
- Use the test result, not the heatmap, to decide
See the Full Journey with Heatmaps and Session Recordings
Heatmaps aggregate interactions on a single page. Session recordings show one person’s path through several.
Together, they reveal:
- Areas causing confusion or frustration
- How users navigate through your site
- Where they encounter roadblocks or drop off
The usual workflow is heatmap first to find the page, then recordings of sessions on that page to see what is happening.
Get User Feedback with Heatmaps and On-Page Surveys
Surveys supply the “why” that heatmaps cannot:
- Heatmaps identify a confusing area
- Ask users a question about that specific area
- Use their answers to understand the issue
- Make the change, then test it
| Tool Combination | Benefits |
|---|---|
| Heatmaps + A/B Testing | Test and validate UX changes |
| Heatmaps + Session Recordings | See the full user journey |
| Heatmaps + On-Page Surveys | Get targeted user feedback |
8. Continuously Test and Improve
Heatmap data is worth collecting only if something changes as a result. Otherwise it is an expensive screensaver.
Combine Heatmaps with A/B Testing
A/B testing means running two versions of a page and comparing outcomes. Heatmaps suggest what to test; the test decides whether you were right.
Analyze User Behavior Over Time
Comparing heatmaps from different periods shows how behavior shifts after a change. Take a baseline map before you redesign anything, because you cannot go back and collect one afterwards.
Iterate and Refine
Make changes based on behavior data, then measure again. Change one significant thing at a time, or you will not know which change did the work.
| Testing Method | Purpose |
|---|---|
| Heatmaps + A/B Testing | Test design changes and validate improvements |
| Heatmap Comparisons | Identify trends and patterns in user behavior |
| Iterative Design | Refine your website based on user insights |
9. Respect User Privacy and Follow Regulations
Heatmap and session recording tools collect behavioural data about identifiable visitors, which puts them squarely inside GDPR and CCPA scope. This is not a formality, and “our vendor handles it” is not a defence: as the site operator you are the controller.
What that means in practice:
- Have a lawful basis. In the EU and UK these tools normally require consent, obtained before the script runs, not after.
- Disclose it. Name the behavioural analytics in your privacy notice and say what is collected and how long it is kept.
- Suppress sensitive input. Every serious tool can mask form fields. Turn masking on for anything containing personal data, payment details, or health information, and verify it works by recording a test session yourself.
- Set a retention period and actually enforce it.
- Honour opt-outs and deletion requests, which means knowing how to find and delete one visitor’s recordings.
Separately from compliance, your tool will ask you to configure which pages and devices to record and over what date range. That is scoping, not compliance, though recording less is a good way to reduce your exposure.
| Compliance Requirement | Description |
|---|---|
| Lawful basis | Usually consent in the EU and UK, obtained before tracking starts |
| Transparency | Disclose collection and use in the privacy notice |
| Input masking | Suppress form fields containing personal or payment data |
| Retention limits | Delete recordings on a defined schedule |
| Data subject rights | Be able to locate and delete an individual’s data on request |
10. Collaborate with Cross-Functional Teams
Heatmap findings that stay inside the analytics team change nothing.
Why Collaborate?
- Get different readings of ambiguous data
- Understand user needs and expectations
- Agree what is worth fixing
- Get fixes into the actual roadmap
Who to Involve?
| Team | Role |
|---|---|
| UX Design | Identify friction points in user journeys |
| Product Management | Prioritize features and updates based on insights |
| Engineering | Judge what a fix actually costs |
| Marketing | Optimize campaigns using user behavior data |
How to Collaborate?
- Review heatmap findings on a regular cadence
- Turn each agreed finding into a specific ticket, not a general observation
- Report back on whether the change worked
Comparing Heatmap Types
| Heatmap Type | Pros | Cons |
|---|---|---|
| Click Heatmaps | Show where users click most often; help optimize button and link placement; reveal confusing or missed elements | Don’t show why users click; can’t track scrolling behavior |
| Scroll Heatmaps | Show how far users scroll; identify drop-off points; find false page bottoms | Less useful for short pages; don’t explain user actions |
| Mouse Movement Heatmaps | Cheap to collect; may hint at areas of interest | Weak link between cursor position and attention; easy to over-read |
| Eye-Tracking Heatmaps | Genuinely measure attention | Expensive; small samples; needs explicit consent |
When choosing a heatmap tool, consider:
- Heatmap types offered: Click, scroll, mouse movement, mobile
- Data visualization and filtering: Can you segment the way you need to?
- Integration with other analytics: For a complete view of user behavior
- Performance impact: These tools add a third-party script. Measure your Core Web Vitals with and without it.
- User privacy and compliance: Input masking, retention controls, and data residency
Summary
Heatmaps show how users interact with your website. Used well, they generate good questions. Used badly, they provide confident-looking support for whatever you already believed.
- Understand Heatmap Types: Click and scroll maps are reliable. Movement maps are suggestive at best. Eye-tracking is the only one that measures attention, and it is expensive.
- Find Hotspots: Use click heatmaps to see where users click, and pay attention to clicks on things that are not clickable.
- Analyze Scrolling: Scroll heatmaps show how far users get. Look for false bottoms.
- Detect Frustration: Rage clicks are the clearest signal you will get. Alert on them.
- Optimize for Mobile: Check mobile separately. The fold is in a different place.
- Segment Users: Unsegmented maps average away the finding. Watch sample sizes when you segment.
- Combine Analytics Tools: Heatmap to find the page, recordings to see the behaviour, surveys to learn why.
- Test and Optimize: A heatmap generates a hypothesis. An A/B test settles it.
- Prioritize Privacy: Get consent, mask inputs, set retention, honour deletion requests.
- Collaborate: Turn findings into tickets, and report whether the fix worked.
FAQs
How can I use heatmaps to improve my website’s user experience?
Use them in these ways:
-
Identify High and Low Engagement Areas
- Click heatmaps show where users click most on desktop and mobile.
- Place calls-to-action and navigation where people already look.
- Investigate low-engagement areas rather than deleting them on sight; sometimes the content is fine and the entry point is broken.
-
Detect User Frustration
- Look for rage clicks, clicks on non-clickable elements, and abandoned flows.
- Fix the interaction the user expected, rather than removing the element.
-
Optimize for Mobile Devices
- Mobile heatmaps reveal small tap targets and crowded controls.
- Check mobile maps separately from desktop.
- Analyze Scrolling Behavior
- Identify the average fold and any false bottoms.
- Make sure the elements that matter sit above the point most people stop.
Do heatmaps slow down my site?
They add a third-party script, so yes, to some degree. Whether it matters depends on the tool and your page weight. Measure your Core Web Vitals with the script enabled and disabled before deciding the trade is worth it, and consider running the tool for defined research periods rather than permanently.
More on this topic
Browse all 53 articles on Data & Analytics.