Inventory risk dashboard software helps businesses manage stockouts, overstocking, and spoilage by turning inventory data into decisions. The right tool provides real-time data, automated alerts, and analytics. Here’s a quick guide to what you should prioritize when selecting software:
- Real-Time Insights: Ensure the dashboard updates inventory, sales, and purchase orders live, with automated alerts for risks like low stock or delays.
- Customizable Views: Tailor dashboards for different roles, allowing each team member to focus on relevant metrics.
- AI and Predictive Analytics: Use tools that forecast demand, identify patterns, and provide recommendations you can check.
- Scalability and Integration: Choose software that grows with your business and connects to essential tools for small businesses like ERP or e-commerce platforms.
- Cost and ROI: Evaluate total costs, including licensing and training, and work out your own savings from reduced stockouts and holding costs.
A note on the numbers. An earlier version of this article carried a series of savings percentages, a costed ROI table, and several customer results that we could not trace to any published source. They have been removed rather than repeated. Where this article now discusses returns, it explains how to calculate them with your own figures.
A well-chosen dashboard saves time, reduces manual error, and supports decisions made on data rather than instinct. Test free trials, and involve the people who will actually use it in the evaluation.
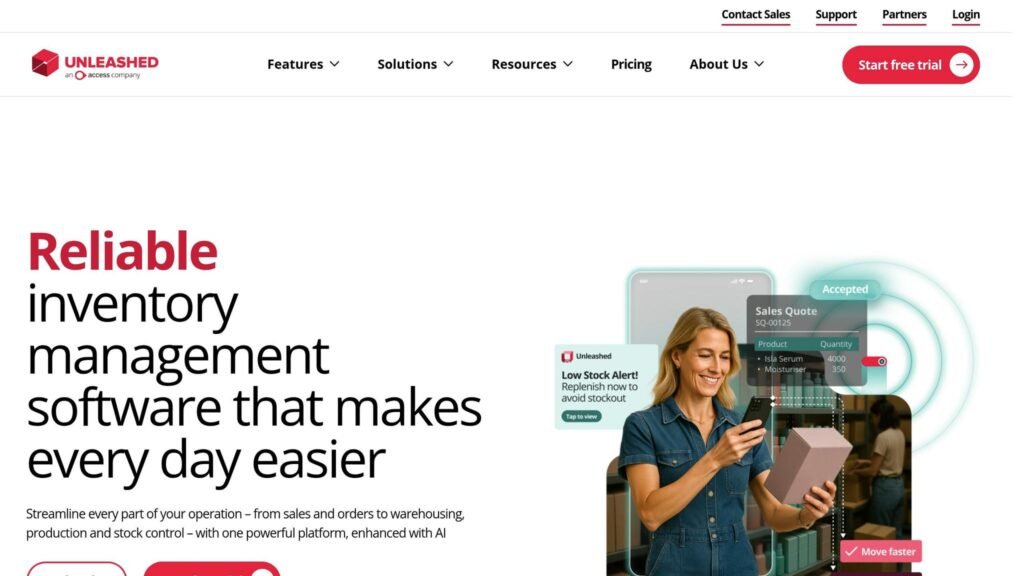
Inventory Analytics: Using Data Analytics Dashboards in Unleashed Inventory Management Software
Key Features to Look for in Inventory Risk Dashboard Software
When choosing inventory risk dashboard software, it’s not about the visuals. The best tools offer real-time insights, customizable layouts, and analytics you can interrogate.
Real-Time Data and Alerts
Effective risk management starts with current information. Your dashboard should provide a centralized view of stock levels, sales, and purchase orders in real time, and deliver automated alerts for problems like low inventory or delayed shipments.
A well-designed dashboard includes risk heatmaps that rank threats by likelihood and impact. These colour-coded grids make it easy to assess risks at a glance, and many systems assign a numerical risk score by multiplying Likelihood (1-5) by Impact (1-5). That scoring is crude, and it is meant to be: its job is to order a list, not to measure anything.
Customizable Dashboards
Not everyone in your organization needs the same data. Customizable dashboards let you tailor views by role – executives want high-level summaries, warehouse managers want operational detail. Being able to rearrange widgets and panels means users see the metrics that matter to their job and not the rest.
No-code tools let non-technical users build and adjust dashboards without IT support. Permission settings keep sensitive data restricted to the people who should see it. A customer quotation previously printed in this section could not be attributed to a checkable source and has been removed.
AI and Predictive Analytics
AI and predictive analytics turn static reports into something that anticipates. Predictive analytics can forecast demand shifts, which helps with cash flow and with cutting excess inventory before it becomes a write-off.
AI can also surface patterns a person would miss, such as a drop in stock levels coinciding with supplier delays. Good systems flag the anomaly and explain why it matters.
Modern tools accept natural language commands, so you can type “show only high-impact risks” or “create a pie chart of inventory value by supplier” instead of building the view by hand. Some generate written commentary on a chart – useful as a first draft of an explanation, not as a conclusion. Treat every AI-generated trend statement as something to verify against the underlying rows, because these systems are confident whether or not they are correct.
How to Choose the Right Software for Your Business
When choosing software, consider how well it matches your business’s size, existing systems, and goals. A tool that suits a small startup may not suit a growing business with several teams. Focus on scalability, integration, and total cost.
Scalability and Flexibility
Businesses grow, and your software needs to grow with you. Look for tools that handle increased workloads and adapt as your needs change. Cloud-based or hybrid systems are a solid choice because they provide access from anywhere and scale as transaction volumes rise. Software with open APIs matters too, because it lets you connect new systems – ERPs, POS platforms, e-commerce tools – as your stack expands.
As your team grows, role-based access controls become important for keeping data restricted while still giving finance and procurement the views they need. No-code or low-code platforms help because non-technical staff can adjust dashboards and workflows without a developer. If international growth is in your plans, check for multi-currency and multilingual support.
The expensive mistake here is not overpaying. It is picking a tool your team does not adopt, which leaves you paying for the software and still running the spreadsheet. Write down clear requirements before you look at a single demo.
Integration with Existing Systems
Disconnected systems slow everything down. Your software should connect to your current tools – accounting software, ERP platforms, e-commerce systems. Native connectors, meaning prebuilt integrations for tools like Shopify, NetSuite, or QuickBooks, cut setup time and avoid custom work. Sync frequency matters more than people expect: a lag of even fifteen minutes between your storefront and your stock record is enough to oversell a fast-moving line. Involve IT and operations to confirm the integration works technically and removes manual re-keying rather than adding a new export step.
Two customer implementation stories previously appeared in this section, both quoting precise before-and-after results. Neither could be sourced, and one described a change in delivery times that was implausible on its face. Both have been removed. If a vendor offers you a reference customer, ask to speak to them directly rather than reading the case study.
Cost and Value Evaluation
Price alone does not determine value. Calculate total cost of ownership: licensing, per-user fees, implementation, training, and the annual uplift written into the contract. A more expensive tool can still be the cheaper choice if it removes work – but you have to quantify the work it removes, not assume it.
The ROI formula is simple: (Gain on Investment – Cost of Investment) / Cost of Investment. The hard part is the gain, and this is where published figures should be treated with suspicion. Savings percentages previously printed here, along with a costed savings table and a statistic attributed to Accenture, could not be traced to a source and have been removed.
Build your own estimate instead, from four numbers you already have:
- Lost sales from stockouts. Take your out-of-stock rate on your top-selling lines, multiply by their average daily margin and the days they were unavailable.
- Holding cost of overstock. Your slow-moving stock value multiplied by your annual carrying rate – warehousing, insurance, capital, obsolescence.
- Fulfilment errors. Number of mis-picks per month multiplied by the cost of putting each one right, including the return shipping and the credit.
- Manual reconciliation. Hours per month spent on stock counts and spreadsheet rework, at a loaded hourly rate.
Then estimate honestly what proportion of each a dashboard removes. It is rarely all of it. A dashboard tells you a line is running out; someone still has to place the order.
Take advantage of free trials to test key workflows, and involve IT, finance, and operations. Sort your requirements into must-haves, nice-to-haves, and future needs so you do not pay upfront for capability you will not use for two years.
How BizBot Simplifies Your Search
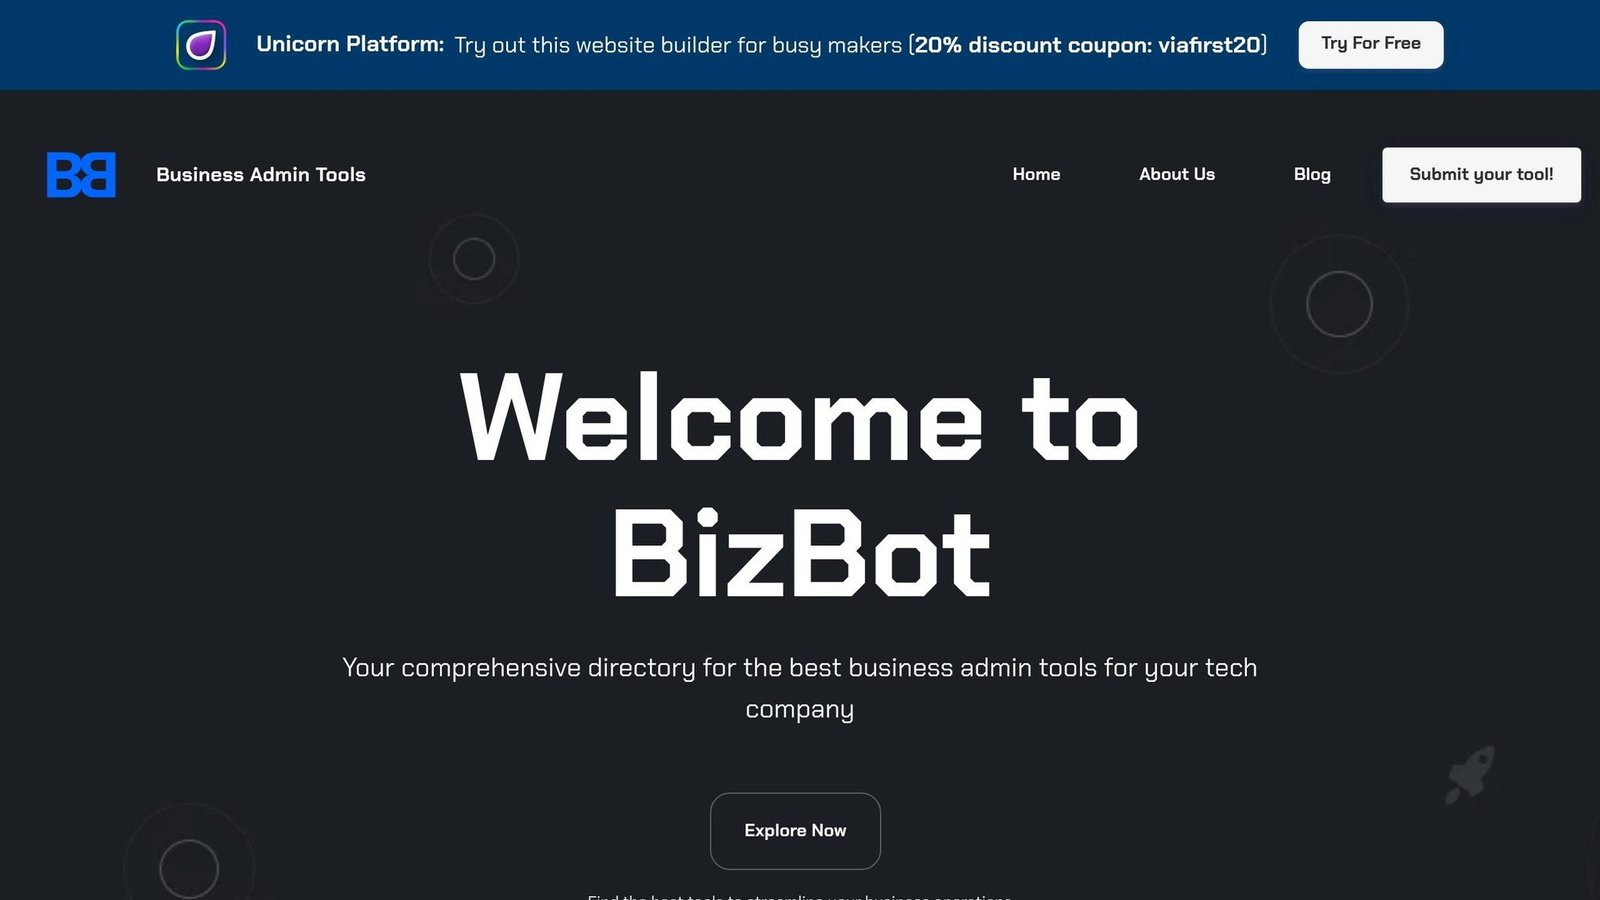
Finding the right inventory risk dashboard software takes time. BizBot makes it easier by putting operational factors side by side – speed to value, automation features, data accuracy, and regulatory compliance – in one place.
Instead of moving between vendor sites, you can compare deployment models: cloud-only platforms such as Zoho Inventory and Katana, against hybrid cloud and on-premise options such as InvGate and ManageEngine. It also separates real-time synchronization from periodic updates, which is the distinction that most affects whether a dashboard is usable for daily operations.
BizBot lists which tools offer free trials and which publish their prices. Review-site scores previously quoted here could not be verified against the review sites themselves and have been removed; check current ratings on G2, Capterra or Gartner Peer Insights directly, and read the one-star reviews rather than the average.
The directory also sorts by business size and industry. A small distributor looking at Acctivate and a large enterprise weighing Oracle NetSuite are solving different problems, and the shortlists should not overlap much. It also flags which platforms connect to tools you already run, such as QuickBooks, HubSpot, or a BI system.
If you want to build a custom dashboard rather than buy one, no-code tools such as Softr are also listed.
Steps to Evaluate and Implement Inventory Risk Dashboard Software
Assess Your Business Needs
Start by mapping your workflows and identifying who will use the dashboard. A warehouse manager tracking daily pick accuracy needs different things from an executive reviewing quarterly supplier performance. Review your existing data infrastructure and list every connected system: ERP, Warehouse Management System (WMS), Transportation Management System (TMS), supplier portals.
Standardize your data – receipt dates, product names, SKU codes, categories – before you connect anything. Inconsistent SKU formats are the single most common reason these projects produce dashboards nobody trusts. Run an ABC classification to segment products by value contribution, so you know which lines justify attention.
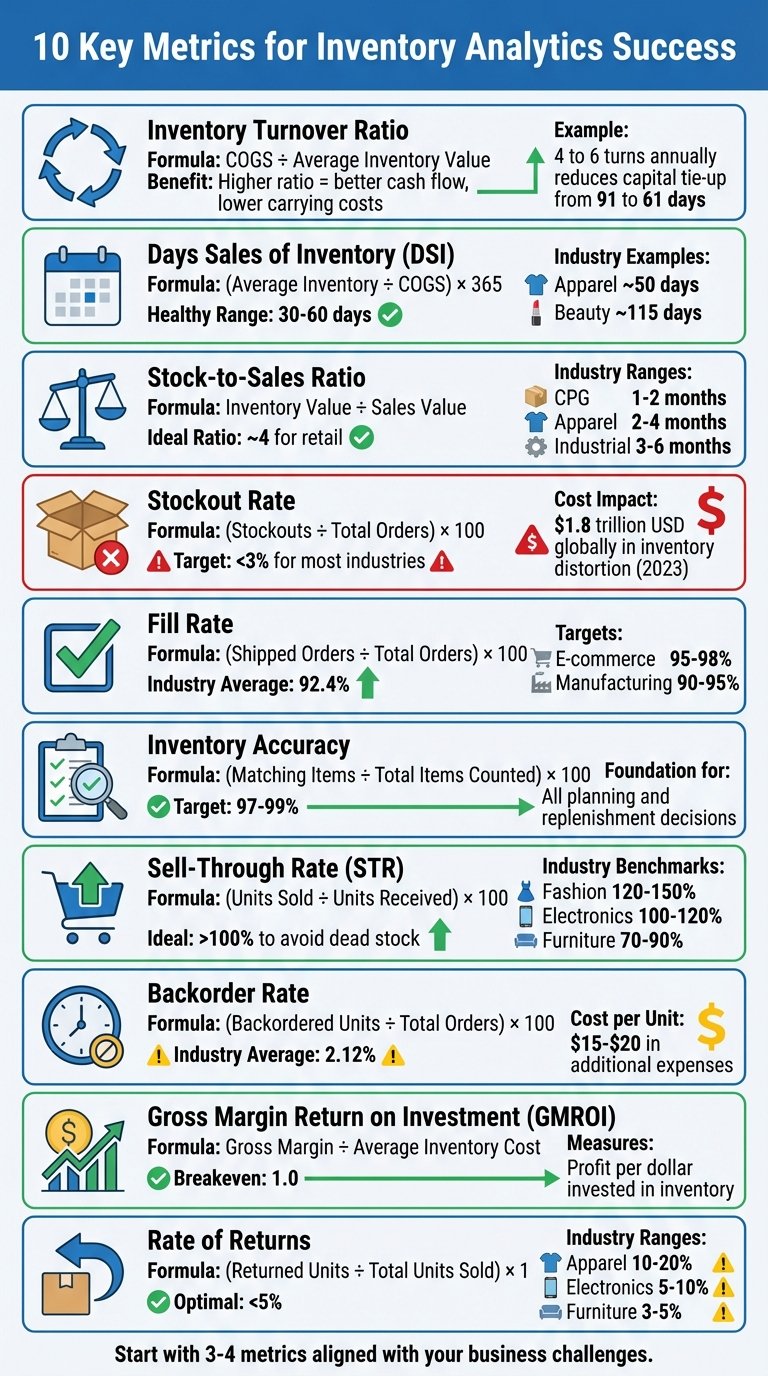
Decide how often data should refresh. Operational metrics may need updating several times a day; strategic metrics can wait. Start with three to five key metrics – Inventory Turnover Ratio, Days of Supply, Stockout Rate – rather than building everything at once. Benchmark improvement figures previously quoted here could not be sourced and have been removed; measure your own baseline before go-live so you can tell whether anything changed.
Test Features with a Free Trial
Use free trials to test data integration and function, not features in the abstract. Confirm the software connects to your actual sources – Excel, SharePoint, your CRM. Build a Risk Register with columns for Risk ID, Likelihood (1-5), Impact (1-5), and Mitigation Plans, and see how the system handles it. Check whether you can drill from a summary down to the individual transaction, because a number you cannot trace is a number you will not act on.
Set thresholds for key risk indicators to trigger alerts on stockouts or aging inventory. If the tool is cloud-based, test real-time updates by changing a value in your source spreadsheet and confirming the dashboard reflects it. Verify that it calculates Inventory Turnover Ratio, Sell-through Rate, and Stockout Duration the way your finance team defines them – definitions vary, and a mismatch here will discredit the whole dashboard. Confirm that sensitive data is restricted to authorized users.
Implement and Train Your Team
Centralize inventory tracking in one system to remove data silos. Assign roles and responsibilities, including someone accountable for licences. Configure the dashboard to update automatically when assets move or hit maintenance thresholds.
Create role-specific dashboards so users see only what is relevant to their work. It simplifies their experience and limits data exposure. An unnamed customer saving previously quoted here could not be sourced and has been removed. Automate alerts by email or push notification for low stock, likely stockouts, and warranty expiries.
Finally, invest in training. Interactive demos, tutorial videos and hands-on sessions are what determine whether the tool is still in use in six months. A dashboard nobody has been taught to read is a spreadsheet with better colours.
Conclusion
A dashboard that shows current stock positions in real time changes how inventory risk is managed. When selecting one, focus on four things: whether it matches your current needs, whether it grows with you, whether it integrates with what you already run, and whether the cost structure makes sense at your scale.
Prioritize features that address your specific problems. Real-time stock alerts, customizable dashboards, and predictive analytics address stockouts, high carrying costs, and inefficient fulfilment – but only the ones you actually suffer from. Spreadsheets tend to break down once you are running more than a hundred SKUs or selling through several channels, which is the point at which dedicated software stops being optional.
Integration is the other decisive factor. A dashboard that connects directly to your sales channels, accounting software, and shipping tools removes manual data entry; one that does not simply moves the typing somewhere else. A specific time saving previously quoted here could not be sourced and has been removed – measure your own before and after instead.
Judge these tools on operational impact rather than the monthly fee. A capable inventory risk dashboard gives decision-makers the data to set realistic targets and to notice a problem while it is still small. A business example previously cited in this section drew a causal link we could not support, and has been removed.
For a shorter selection process, BizBot offers a curated directory of business tools, including inventory management solutions for freelancers, small businesses, and growing companies, with an emphasis on options that publish their pricing.
FAQs
What inventory risks should I track first?
Three stand out: stockouts, overstocking, and inefficiency in fulfilment.
Track real-time stock levels, demand forecasts, and indicators like Days on Hand and Inventory Turnover Ratio. Those tell you where you stand today.
Automated alerts matter most for stockouts, because the warning is only useful if it arrives before the shelf is empty. Reviewing demand trends and seasonal patterns is the counterpart on the overstock side.
If you hold inventory in several locations, tracking across all of them lets you redistribute rather than reorder, which is usually cheaper.
How real-time does my inventory dashboard need to be?
It needs to reflect changes – new orders, stock adjustments – immediately, or close to it. If genuine real-time is not available, frequent and predictable updates are the next best thing. Remember that the dashboard cannot be fresher than the system feeding it: if your inventory system posts in overnight batches, a real-time dashboard shows you last night’s position in a nicer font.
What should I test during a free trial before buying?
During a free trial, focus on these:
- Features and functionality: Does it do what you need – stock tracking, automated reorders – on your own data?
- Ease of use: Can the people who will use it daily navigate it without help?
- Performance: How quickly does it sync, and how does it behave with your full SKU count?
- Integration: Does it connect to your existing systems without custom work?
- Support: How fast is the response, and is it available in your time zone?
- Trial limitations: Duration, whether a credit card is required, and which features are held back.
Test on real data. A trial run on the vendor’s sample catalogue tells you nothing about how the tool handles your SKU naming.
More on this topic
Browse all 53 articles on Data & Analytics.