Mobile Business Intelligence (BI) allows users to access and analyze business data on smartphones and tablets. Here are the top 10 mobile BI tools for 2024:
-
Zoho Analytics
- Data visualization with charts, tables, and dashboards
- Real-time data access
- Intuitive mobile app with gesture navigation
- Integrates with various data sources
-
Microsoft Power BI
- Interactive dashboards, reports, and charts
- Real-time data updates
- Collaboration features
- Connects to Excel, SQL Server, and more
-
Tableau Mobile
- Interactive dashboards and reports
- Real-time data access with offline mode
- Intuitive mobile app with gesture navigation
- Supports various authentication methods
-
Qlik Sense
- Interactive dashboards, reports, and charts
- Real-time data access with offline mode
- Intuitive mobile app with gesture navigation
-
Sisense
- Optimized data visualizations for mobile
- Push notifications for real-time updates
- Intuitive mobile app with easy navigation
-
Domo
- Real-time, interactive, and customizable dashboards
- Custom alerts and real-time data access
- Integrated chat and collaboration features
- Intuitive mobile app
-
MicroStrategy
- Relational OLAP and multidimensional databases
- Custom mobile apps with analytics and transactions
- Workflow support and mobile app development
- Easy app creation and rapid deployment
-
IBM Cognos Analytics
- View dashboards, stories, and explorations
- Monitor KPIs and set alerts
- Self-service analytics and IT integration
- Intuitive touch experience and natural language queries
-
Looker
- View dashboards and reports
- Real-time data access and KPI monitoring
- Self-service analytics and IT integration
- Intuitive touch experience
- SAP BusinessObjects BI
-   Interactive visualizations and dashboards
-   Real-time access to business dashboards
-   Monitor KPIs and share findings
-   Immersive mobile experience
Related video from YouTube
Quick Comparison
| Tool | Data Visualization | Real-time Data | Mobile Experience | Collaboration | Integration |
|---|---|---|---|---|---|
| Zoho Analytics | ✔ | ✔ | ✔ | ✔ | |
| Microsoft Power BI | ✔ | ✔ | ✔ | ✔ | ✔ |
| Tableau Mobile | ✔ | ✔ | ✔ | ✔ | |
| Qlik Sense | ✔ | ✔ | ✔ | ||
| Sisense | ✔ | ✔ | ✔ | ||
| Domo | ✔ | ✔ | ✔ | ✔ | |
| MicroStrategy | ✔ | ✔ | ✔ | ✔ | |
| IBM Cognos Analytics | ✔ | ✔ | ✔ | ✔ | ✔ |
| Looker | ✔ | ✔ | ✔ | ✔ | ✔ |
| SAP BusinessObjects BI | ✔ | ✔ | ✔ |
These mobile BI tools enable businesses to access and analyze data on-the-go, driving better decision-making and efficiency.
1. Zoho Analytics
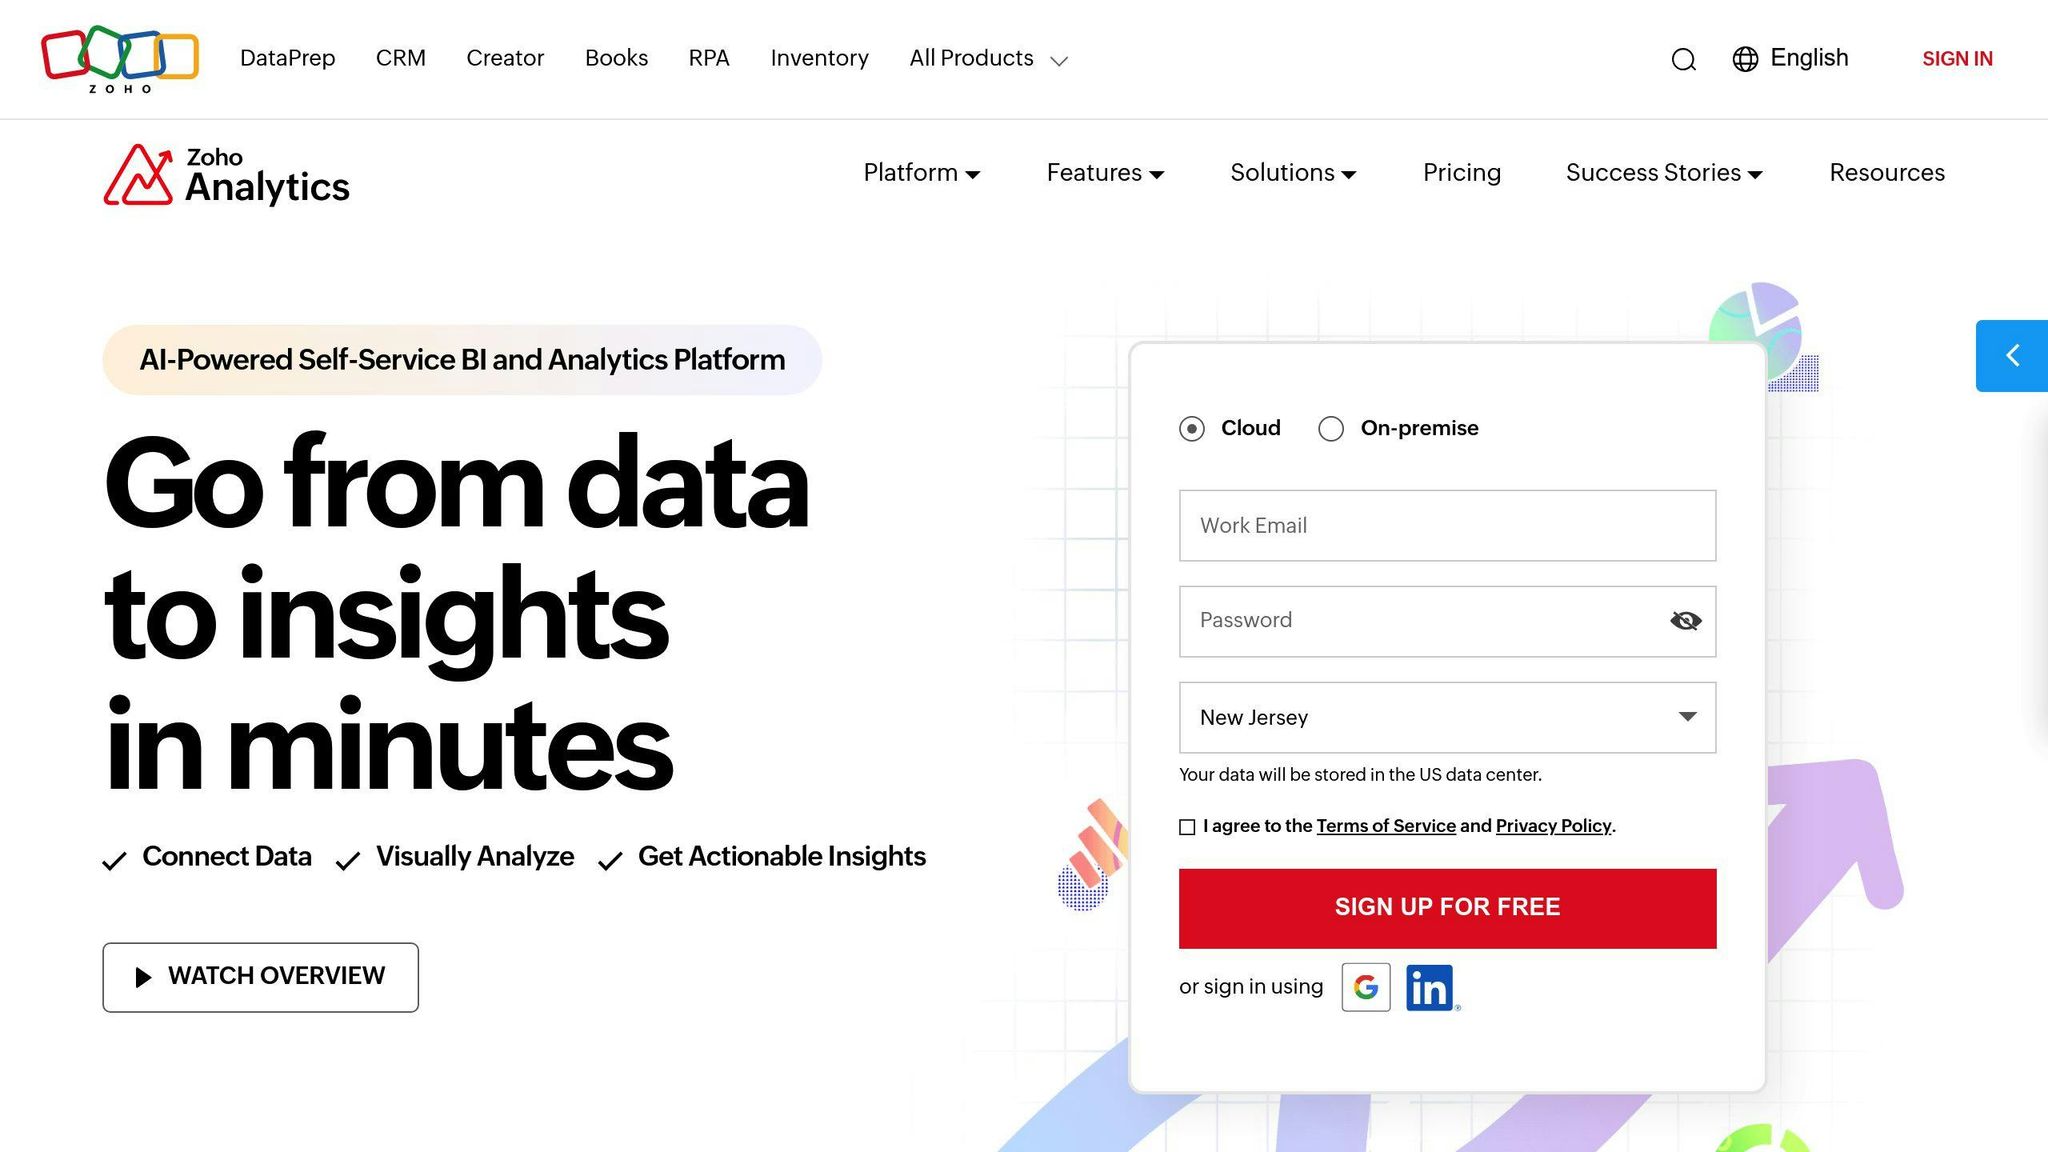
Zoho Analytics is a popular mobile business intelligence tool that helps users make data-driven decisions on-the-go. Here are its key capabilities:
Data Visualization
Zoho Analytics offers various data visualization options, including charts, tables, and dashboards, to help users easily understand and analyze their data. Its mobile app allows users to access and interact with these visualizations from anywhere, at any time.
Real-time Data
With Zoho Analytics, users can access real-time data and updates, enabling them to respond quickly to changes in their business.
Mobile User Experience
The Zoho Analytics mobile app is designed to provide an intuitive and user-friendly experience, with features such as gesture-based navigation and customizable dashboards.
Integration
Zoho Analytics can integrate with a wide range of data sources, including CRM systems, databases, and cloud storage services. This allows users to connect their data from various sources and analyze it in a single platform.
Here is a summary of Zoho Analytics' key features:
| Feature | Description |
|---|---|
| Data Visualization | Charts, tables, and dashboards for easy data analysis |
| Real-time Data | Access to real-time data and updates |
| Mobile User Experience | Intuitive and user-friendly mobile app |
| Integration | Connects with various data sources, including CRM systems and cloud storage services |
Overall, Zoho Analytics is a powerful mobile BI tool that offers a range of features to help users analyze and act on their data, wherever they are.
2. Microsoft Power BI
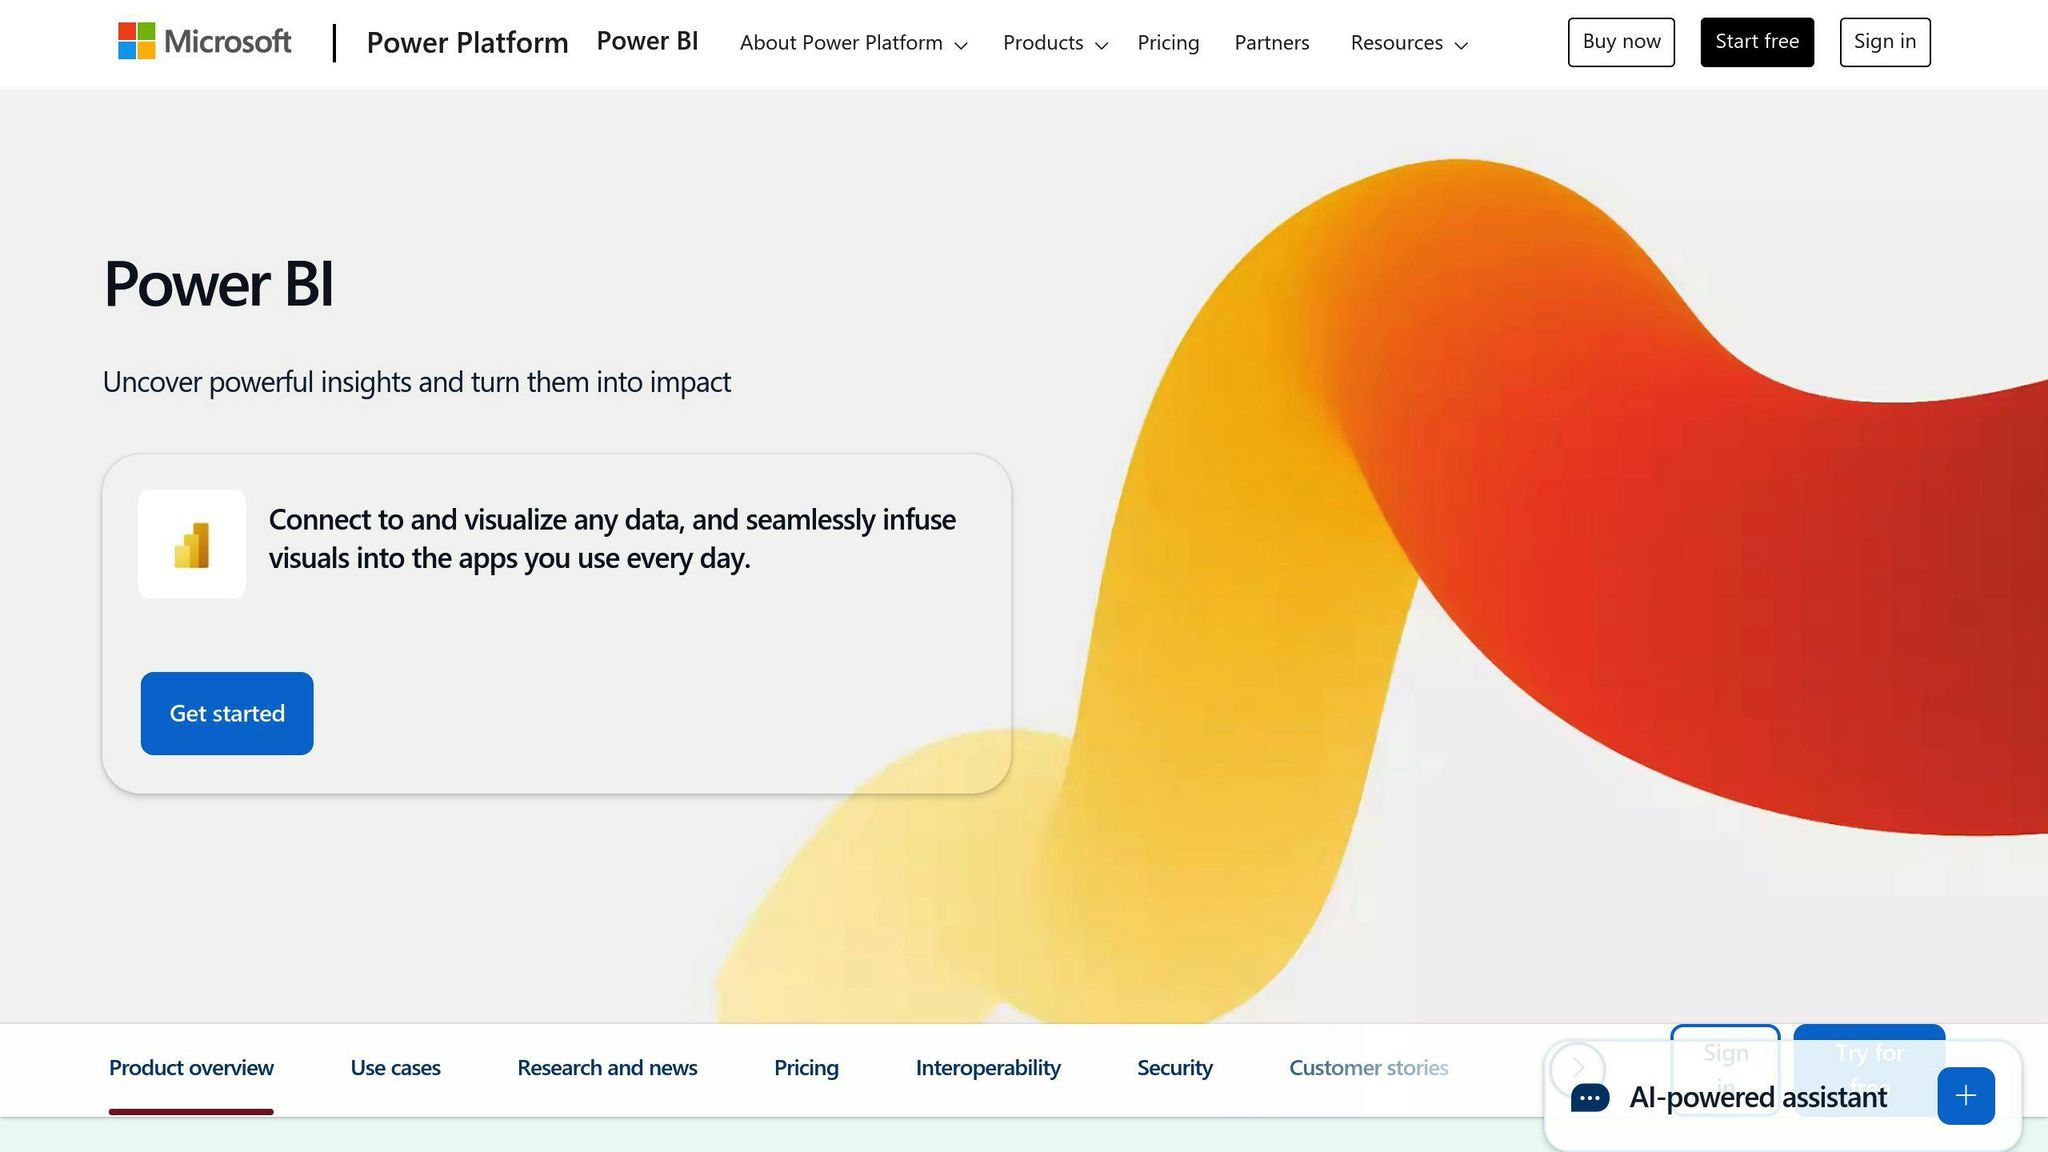
Microsoft Power BI is a powerful mobile business intelligence tool that helps users make data-driven decisions on-the-go. Here are its key capabilities:
Data Visualization
Power BI offers various data visualization options, including interactive dashboards, reports, and charts. These visualizations enable users to easily analyze and understand their data.
Real-time Data
Power BI provides real-time data access, allowing users to stay up-to-date with the latest changes in their business.
Collaboration
Power BI offers robust collaboration features, enabling users to share insights and data with others across their organization.
Mobile User Experience
The Power BI mobile app is designed to provide an intuitive and user-friendly experience, with features such as gesture-based navigation and customizable dashboards.
Integration
Power BI can integrate with a wide range of data sources, including Microsoft Excel, SQL Server, and Azure.
Here is a summary of Power BI's key features:
| Feature | Description |
|---|---|
| Data Visualization | Interactive dashboards, reports, and charts |
| Real-time Data | Real-time data access and updates |
| Collaboration | Robust collaboration features for sharing insights |
| Mobile User Experience | Intuitive and user-friendly mobile app |
| Integration | Connects with various data sources, including Excel and SQL Server |
Overall, Microsoft Power BI is a powerful mobile BI tool that offers a range of features to help users analyze and act on their data, wherever they are.
3. Tableau Mobile
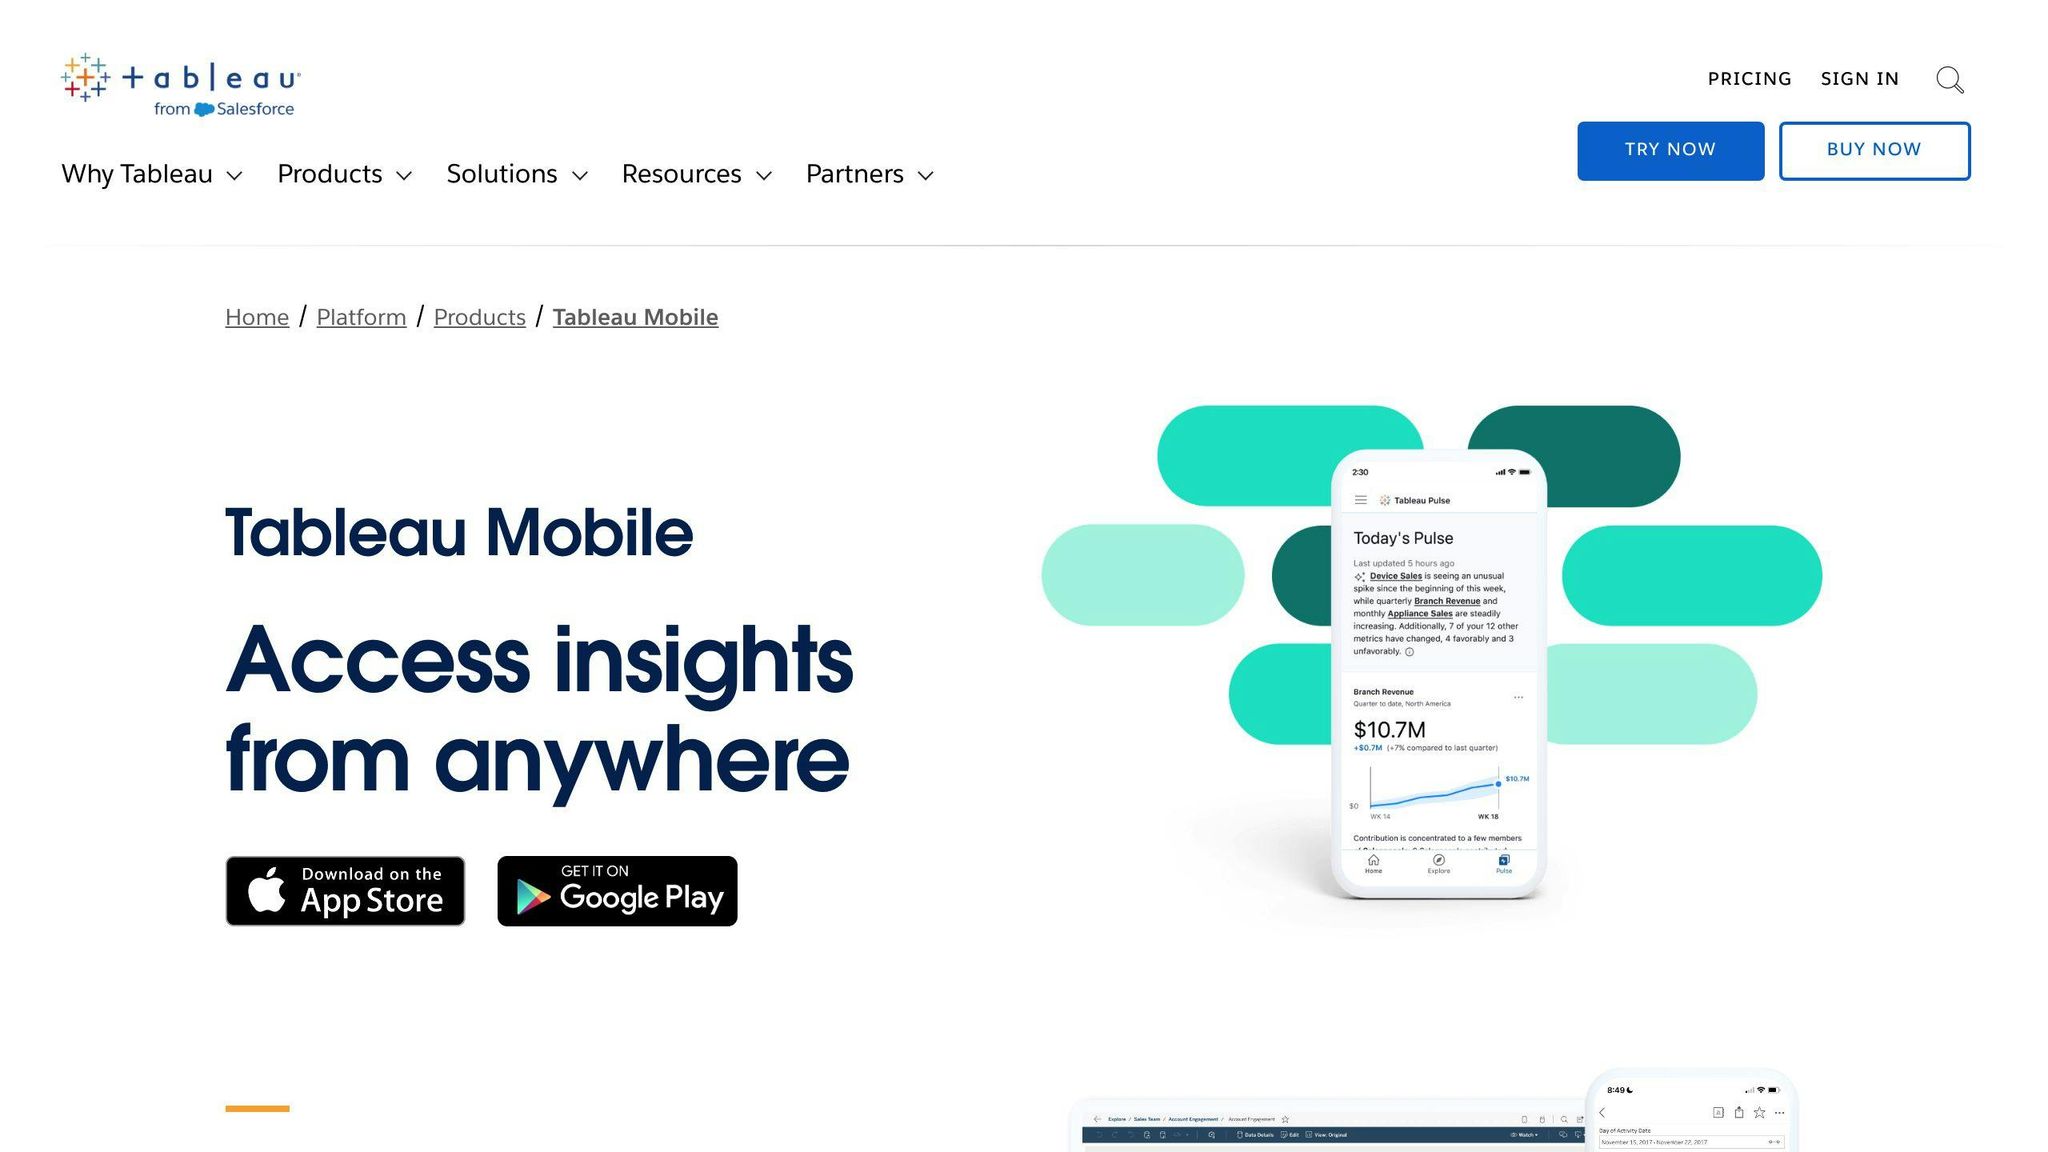
Tableau Mobile is a powerful mobile business intelligence tool that enables users to access and interact with their data on-the-go. Here are its key capabilities:
Data Visualization
Tableau Mobile offers various data visualization options, including interactive dashboards, reports, and charts. These visualizations enable users to easily analyze and understand their data.
| Visualization Type | Description |
|---|---|
| Interactive Dashboards | Analyze and understand data with interactive dashboards |
| Reports | View detailed reports to gain insights |
| Charts | Visualize data with various chart types |
Real-time Data Access
Tableau Mobile provides real-time data access, allowing users to stay up-to-date with the latest changes in their business. With interactive previews, users can access their data even when offline, and sync with the latest version once they're connected.
Mobile User Experience
The Tableau Mobile app is designed to provide an intuitive and user-friendly experience, with features such as gesture-based navigation and customizable dashboards. Users can mark their favorite dashboards or views to always have them at their fingertips.
Integration with Other Systems
Tableau Mobile can integrate with various authentication methods, ensuring devices and data remain secure at all times.
| Authentication Method | Description |
|---|---|
| SAML | Secure authentication with SAML |
| OpenID Connect | Authenticate with OpenID Connect |
| Mutual SSL | Secure authentication with Mutual SSL |
| VPN or Reverse Proxy | Authenticate with VPN or Reverse Proxy |
| MDM with AppConfig and MAM | Authenticate with MDM and AppConfig |
Here is a summary of Tableau Mobile's key features:
| Feature | Description |
|---|---|
| Data Visualization | Interactive dashboards, reports, and charts |
| Real-time Data | Real-time data access and updates |
| Mobile User Experience | Intuitive and user-friendly mobile app |
| Integration | Supports various authentication methods for secure integration |
Overall, Tableau Mobile is a powerful mobile BI tool that offers a range of features to help users analyze and act on their data, wherever they are.
4. Qlik Sense
Qlik Sense is a powerful mobile business intelligence tool that provides users with an interactive analytics experience on-the-go. Here are its key capabilities:
Data Visualization
Qlik Sense offers various data visualization options, including:
| Visualization Type | Description |
|---|---|
| Interactive Dashboards | Analyze and understand data with interactive dashboards |
| Reports | View detailed reports to gain insights |
| Charts | Visualize data with various chart types |
Real-time Data Access
Qlik Sense provides real-time data access, allowing users to stay up-to-date with the latest changes in their business. The tool also offers an offline mode, enabling users to access their data even when they don't have an internet connection, and sync with the latest version once they're connected.
Mobile User Experience
The Qlik Sense mobile app is designed to provide an intuitive and user-friendly experience, with features such as gesture-based navigation and customizable dashboards. Users can mark their favorite dashboards or views to always have them at their fingertips.
Here is a summary of Qlik Sense's key features:
| Feature | Description |
|---|---|
| Data Visualization | Interactive dashboards, reports, and charts |
| Real-time Data | Real-time data access and updates |
| Mobile User Experience | Intuitive and user-friendly mobile app |
Overall, Qlik Sense is a powerful mobile BI tool that offers a range of features to help users analyze and act on their data, wherever they are.
5. Sisense
Sisense is a powerful mobile business intelligence tool that provides users with an interactive analytics experience on-the-go. Here are its key capabilities:
Data Visualization
Sisense offers optimized data visualizations for mobile display, allowing users to view and interact with their dashboards via touchscreen. The tool also provides mobile-friendly folder navigation and a search box to easily find dashboards.
| Data Visualization Feature | Description |
|---|---|
| Mobile-friendly folder navigation | Easily navigate through folders on mobile devices |
| Search box | Quickly find dashboards using the search box |
Real-time Data Access
Sisense supports push notifications directly from Sisense Pulse, ensuring users stay up-to-date with the latest changes in their business.
Mobile User Experience
The Sisense Mobile app is designed to provide an intuitive and user-friendly experience, with features such as single-click login, easy navigation, and responsive visualizations. Users can explore their dashboards with simple gestures, apply filters to view the data they want, and access their data anywhere, anytime.
Here is a summary of Sisense's key features:
| Feature | Description |
|---|---|
| Data Visualization | Optimized for mobile display, interactive dashboards |
| Real-time Data | Push notifications from Sisense Pulse |
| Mobile User Experience | Intuitive and user-friendly mobile app |
Overall, Sisense is a powerful mobile BI tool that offers a range of features to help users analyze and act on their data, wherever they are.
6. Domo
Domo is a top mobile BI application that helps businesses stay competitive and efficient. Here are its key capabilities:
Data Visualization
Domo provides real-time data visualizations, allowing users to gain insights into their business with interactive and customizable dashboards. The app offers various visualization options, including:
| Visualization Type | Description |
|---|---|
| Cards | Visualize data in a card format |
| Charts | Analyze data with various chart types |
| Tables | View data in a tabular format |
Real-time Data
Domo's mobile app provides users with real-time access to their business data, enabling them to make informed decisions on-the-go. The app also offers custom alerts, ensuring users stay up-to-date with the latest changes in their business.
Collaboration
Domo's mobile app offers integrated chat, enabling users to collaborate with anyone in their company. The app also provides a company directory and interactive org chart, making it easy to get in touch with the right person, fast.
Mobile User Experience
The Domo mobile app is designed to provide an intuitive and user-friendly experience, with features such as simple navigation, responsive visualizations, and snapshot annotations. Users can explore their dashboards with ease, apply filters to view the data they want, and access their data anywhere, anytime.
Here is a summary of Domo's key features:
| Feature | Description |
|---|---|
| Data Visualization | Real-time, interactive, and customizable dashboards |
| Real-time Data | Custom alerts and real-time access to business data |
| Collaboration | Integrated chat and company directory |
| Mobile User Experience | Intuitive and user-friendly mobile app |
Overall, Domo is a powerful mobile BI tool that offers a range of features to help users analyze and act on their data, wherever they are.
sbb-itb-d1a6c90
7. MicroStrategy
MicroStrategy is a top mobile BI application that helps businesses stay competitive and efficient. Here are its key capabilities:
Data Visualization Capabilities
MicroStrategy offers relational OLAP (ROLAP) and multidimensional databases, allowing users to drill down to transactional levels and gain deep insights into their business. This approach ensures data consistency and streamlines functions.
| Capability | Description |
|---|---|
| Relational OLAP | Drill down to transactional levels |
| Multidimensional databases | Gain deep insights into business |
Real-time Data Access
MicroStrategy Mobile enables users to create custom mobile apps with analytics, transactions, mapping, multimedia, and business workflows. These apps are optimized for both iOS and Android.
| Feature | Description |
|---|---|
| Custom mobile apps | Analytics, transactions, mapping, multimedia, and business workflows |
| Platform support | Optimized for iOS and Android |
Collaboration Features
MicroStrategy Mobile supports workflows that lead users through data to decisions. It also provides a new way to develop and deploy mobile applications.
| Feature | Description |
|---|---|
| Workflow support | Lead users through data to decisions |
| Mobile app development | Develop and deploy mobile applications |
Mobile User Experience
MicroStrategy Mobile offers the following benefits:
| Benefit | Description |
|---|---|
| Easy app creation | Create professional applications easily |
| Rapid deployment | Deploy updates quickly |
| Reduced development time | Develop applications faster |
Here is a summary of MicroStrategy's key features:
| Feature | Description |
|---|---|
| Data Visualization | Relational OLAP and multidimensional databases |
| Real-time Data | Custom mobile apps with analytics and transactions |
| Collaboration | Supports workflows and mobile app development |
| Mobile User Experience | Easy app creation, rapid deployment, and reduced development time |
Overall, MicroStrategy is a powerful mobile BI tool that offers a range of features to help users analyze and act on their data, wherever they are.
8. IBM Cognos Analytics
IBM Cognos Analytics is a powerful mobile BI tool that helps businesses stay competitive and efficient. Here are its key capabilities:
Data Visualization
IBM Cognos Analytics allows users to view dashboards, stories, and explorations on their mobile devices. The IBM Cognos Analytics Assistant provides a bird's eye view of business performance or dives into details.
| Capability | Description |
|---|---|
| Dashboard view | View dashboards on mobile devices |
| Story view | View stories on mobile devices |
| Exploration view | View explorations on mobile devices |
| Assistant | Get a bird's eye view or dive into details |
Real-time Data
The mobile app provides real-time access to business dashboards, enabling users to monitor important KPIs, share findings with colleagues, and set alerts.
| Feature | Description |
|---|---|
| Real-time access | Access business dashboards in real-time |
| KPI monitoring | Monitor important KPIs |
| Collaboration | Share findings with colleagues |
| Alerts | Set alerts for changes |
Collaboration
IBM Cognos Analytics supports self-service analytics, allowing users to create and find relevant datasets easily. It also integrates with IT to facilitate collaboration.
| Feature | Description |
|---|---|
| Self-service analytics | Create and find datasets easily |
| IT integration | Collaborate with IT |
Mobile User Experience
The app offers an immersive experience, allowing users to interact with reports and dashboards through an intuitive touch experience. It also supports natural language queries.
| Feature | Description |
|---|---|
| Immersive experience | Interact with reports and dashboards |
| Touch experience | Intuitive touch experience |
| Natural language queries | Ask questions and get insights |
Here is a summary of IBM Cognos Analytics' key features:
| Feature | Description |
|---|---|
| Data Visualization | View dashboards, stories, and explorations |
| Real-time Data | Monitor KPIs and set alerts |
| Collaboration | Supports self-service analytics and IT integration |
| Mobile User Experience | Intuitive touch experience and natural language queries |
Overall, IBM Cognos Analytics is a robust mobile BI tool that offers a range of features to help users analyze and act on their data, wherever they are.
9. Looker
Looker is a powerful mobile BI tool that helps users analyze and act on their data, wherever they are.
Data Visualization
Looker provides an intuitive design for quick access to your data. The app organizes content by categories, making it easy to find what you need. You can view user-defined dashboards and LookML dashboards, and access various features.
| Feature | Description |
|---|---|
| Dashboard view | View user-defined dashboards |
| LookML dashboard | View LookML dashboards |
| Category organization | Organize content by categories |
Real-time Data
Looker offers real-time access to your business dashboards, enabling you to monitor important KPIs, share findings with colleagues, and set alerts.
| Feature | Description |
|---|---|
| Real-time access | Access business dashboards in real-time |
| KPI monitoring | Monitor important KPIs |
| Collaboration | Share findings with colleagues |
| Alerts | Set alerts for changes |
Collaboration
Looker supports self-service analytics, allowing users to create and find relevant datasets easily. It also integrates with IT to facilitate collaboration.
| Feature | Description |
|---|---|
| Self-service analytics | Create and find datasets easily |
| IT integration | Collaborate with IT |
Mobile User Experience
The Looker mobile app provides an immersive experience, allowing users to interact with reports and dashboards through an intuitive touch experience.
| Feature | Description |
|---|---|
| Immersive experience | Interact with reports and dashboards |
| Touch experience | Intuitive touch experience |
Here is a summary of Looker's key features:
| Feature | Description |
|---|---|
| Data Visualization | View dashboards and reports |
| Real-time Data | Monitor KPIs and set alerts |
| Collaboration | Supports self-service analytics and IT integration |
| Mobile User Experience | Intuitive touch experience |
Overall, Looker is a robust mobile BI tool that offers a range of features to help users analyze and act on their data, wherever they are.
10. SAP BusinessObjects BI
SAP BusinessObjects BI is a comprehensive mobile business intelligence solution that enables users to access and analyze business data on-the-go.
Data Visualization
SAP BusinessObjects BI offers interactive visualizations to help users analyze key metrics and discover data trends. The application allows users to:
| Feature | Description |
|---|---|
| Extend Dashboards | Extend SAP BusinessObjects Dashboards to Android tablets |
| Extend Documents | Extend SAP BusinessObjects Web Intelligence documents to Android tablets and smartphones |
Real-time Data
SAP BusinessObjects BI provides real-time access to business dashboards, enabling users to:
| Feature | Description |
|---|---|
| Monitor KPIs | Monitor important KPIs |
| Share Findings | Share findings with colleagues |
| Set Alerts | Set alerts for changes |
Mobile User Experience
The SAP BusinessObjects BI mobile app offers an immersive experience, allowing users to interact with reports and dashboards through an intuitive touch experience.
Overall, SAP BusinessObjects BI is a powerful mobile BI tool that offers a range of features to help users analyze and act on their data, wherever they are.
Feature Comparison
Here is a summary table that compares the features, advantages, disadvantages, and pricing of each mobile BI tool for a quick reference guide.
| Mobile BI Tool | Key Features | Advantages | Disadvantages | Pricing |
|---|---|---|---|---|
| Zoho Analytics | Data discovery, predictive analytics, natural language search, reporting/analytics, data visualization, dashboard, query builder, storytelling, data connectors, self-service data preparation, self-service analytics | Easy to use, affordable, robust analytics capabilities | Limited customer support, steep learning curve | $30/month (2 users) |
| Microsoft Power BI | Data visualization, reporting, analysis, AI-powered analytics features, natural language queries | Wide range of features, seamless integration with Microsoft tools, user-friendly | Limited mobile authoring capabilities, expensive | $9.99/user/month (Power BI Pro) |
| Tableau Mobile | Data visualization, interactive analysis, mobile-friendly folder navigation, push notifications | Powerful data visualization, easy to use, fast data analysis | Limited mobile authoring capabilities, expensive | $70/user/month (Tableau Creator) |
| Qlik Sense | Associative data model, data visualization, mobile-friendly interface, push notifications | Robust data analysis, easy to use, fast data analysis | Limited mobile authoring capabilities, expensive | $30/user/month (Qlik Sense Business) |
| Sisense | Data visualization, interactive analysis, mobile-friendly interface, push notifications | Easy to use, fast data analysis, affordable | Limited mobile authoring capabilities, limited customer support | $30/user/month (Sisense) |
| Domo | Data visualization, interactive analysis, mobile-friendly interface, push notifications | Robust data analysis, easy to use, fast data analysis | Limited mobile authoring capabilities, expensive | Custom pricing |
| MicroStrategy | Data visualization, interactive analysis, mobile-friendly interface, push notifications | Robust data analysis, easy to use, fast data analysis | Limited mobile authoring capabilities, expensive | Custom pricing |
| IBM Cognos Analytics | Data visualization, interactive analysis, mobile-friendly interface, push notifications | Robust data analysis, easy to use, fast data analysis | Limited mobile authoring capabilities, expensive | Custom pricing |
| Looker | Data visualization, interactive analysis, mobile-friendly interface, push notifications | Robust data analysis, easy to use, fast data analysis | Limited mobile authoring capabilities, expensive | Custom pricing |
| SAP BusinessObjects BI | Data visualization, interactive analysis, mobile-friendly interface, push notifications | Robust data analysis, easy to use, fast data analysis | Limited mobile authoring capabilities, expensive | Custom pricing |
This table provides a quick comparison of the features, advantages, disadvantages, and pricing of each mobile BI tool, helping you make an informed decision when choosing the best tool for your business needs.
Evaluation Criteria
When choosing a mobile BI tool, consider the following key criteria to ensure you make an informed decision.
Architecture
The tool should be accessible and properly formatted on all mobile devices and operating systems, including smartphones and tablets. This is crucial because users need to access BI insights effectively, regardless of their device.
Usability
The tool should have a clear, easy-to-use design, making it simple to view and search business information on a small screen with minimal effort.
Data Source Connectivity
The tool should be able to connect to various data sources, including cloud-based and on-premise systems. This ensures users can access all necessary data to make informed decisions.
Offline Access
The tool should allow users to access and analyze data even when they don't have an internet connection. This is particularly important for users who are always on the go or work in areas with limited internet connectivity.
Security
The tool should have robust security features to protect sensitive business data. This includes features such as encryption, authentication, and authorization.
Here is a summary table of the evaluation criteria:
| Criteria | Description |
|---|---|
| Architecture | Accessible on all mobile devices and operating systems |
| Usability | Easy to use, simple design |
| Data Source Connectivity | Connects to various data sources |
| Offline Access | Accessible without internet connection |
| Security | Robust security features to protect data |
By considering these evaluation criteria, you can ensure you choose a mobile BI tool that meets your business needs and provides the necessary insights to drive growth and success.
Final Thoughts
In conclusion, the top 10 mobile BI tools discussed in this article offer a range of features and benefits that can help businesses stay competitive and efficient.
Key Takeaways
By leveraging mobile BI, organizations can:
- Increase productivity
- Improve decision-making
- Drive growth
When selecting a mobile BI tool, consider the following key evaluation criteria:
| Criteria | Description |
|---|---|
| Architecture | Accessible on all mobile devices and operating systems |
| Usability | Easy to use, simple design |
| Data Source Connectivity | Connects to various data sources |
| Offline Access | Accessible without internet connection |
| Security | Robust security features to protect data |
Choosing the Right Tool
Remember, the right mobile BI tool can make all the difference in driving business success. Take the time to evaluate your options carefully, and choose a tool that aligns with your business goals and objectives.
By doing so, businesses can ensure they choose a tool that meets their specific needs and provides the necessary insights to drive success.
FAQs
What are mobile business intelligence applications?
Mobile business intelligence (BI) applications are software that allows users to access and analyze business data, reports, and dashboards on mobile devices like smartphones and tablets. This enables users to make informed decisions anywhere, anytime, and stay updated on business performance.
Here are some popular mobile BI applications:
| Application | Description |
|---|---|
| Sisense | Access and analyze business data on-the-go |
| Roambi Analytics | Mobile analytics and reporting |
| Microsoft Power BI Pro | Business intelligence and analytics |
| IBM Cognos Analytics | Business intelligence and analytics |
| Amazon QuickSight | Fast, cloud-powered business intelligence |
| MicroStrategy | Enterprise-grade business intelligence |
| WebFOCUS Platform | Business intelligence and analytics |
| Dimensional Insight | Business intelligence and analytics |
| SAP BusinessObjects BI | Business intelligence and analytics |
| Domo | Business intelligence and analytics |
| Oracle Business Intelligence | Business intelligence and analytics |
| Dundas BI | Business intelligence and analytics |
| Yellowfin | Business intelligence and analytics |
| InetSoft Style Intelligence | Business intelligence and analytics |
| TARGIT | Business intelligence and analytics |
These applications help businesses stay competitive and efficient by providing easy access to business insights and data analysis.