In today’s data-driven world, businesses rely on statistical analysis software to make informed decisions. This article explores the top 10 statistical analysis software options, highlighting their key features, strengths, and weaknesses to help you choose the best fit for your needs.
Key Features to Consider:
- Data Analysis Capabilities: Regression analysis, predictive modeling, forecasting, machine learning, clustering, and statistical process control.
- Data Visualization: Interactive dashboards, charts, graphs, plots, and conditional formatting for clear data presentation.
- Integration: Seamless integration with other tools, databases, and cloud storage services.
- Scalability: Ability to handle large datasets and scale with your business growth.
- User Experience: Intuitive interface, tutorials, and resources for easy learning and use.
Quick Comparison
| Software | Data Analysis | Visualization | Integration | Scalability | User Experience | Cost |
|---|---|---|---|---|---|---|
| IBM SPSS Statistics | ⭐⭐⭐⭐⭐ | ⭐⭐⭐⭐⭐ | ⭐⭐⭐⭐⭐ | ⭐⭐⭐⭐⭐ | ⭐⭐⭐⭐⭐ | $$$$ |
| MATLAB | ⭐⭐⭐⭐⭐ | ⭐⭐⭐⭐⭐ | ⭐⭐⭐⭐⭐ | ⭐⭐⭐⭐⭐ | ⭐⭐⭐⭐ | $$$$ |
| Stata | ⭐⭐⭐⭐⭐ | ⭐⭐⭐⭐⭐ | ⭐⭐⭐⭐ | ⭐⭐⭐⭐ | ⭐⭐⭐⭐⭐ | $$$$ |
| Tableau | ⭐⭐⭐ | ⭐⭐⭐⭐⭐ | ⭐⭐⭐⭐⭐ | ⭐⭐⭐⭐⭐ | ⭐⭐⭐⭐⭐ | $$$$ |
| Minitab | ⭐⭐⭐⭐⭐ | ⭐⭐⭐⭐ | ⭐⭐⭐ | ⭐⭐⭐⭐ | ⭐⭐⭐⭐⭐ | $$$$ |
| GraphPad Prism | ⭐⭐⭐⭐ | ⭐⭐⭐⭐ | ⭐⭐⭐ | ⭐⭐⭐ | ⭐⭐⭐⭐⭐ | $$$ |
| OriginPro | ⭐⭐⭐⭐ | ⭐⭐⭐⭐ | ⭐⭐⭐ | ⭐⭐⭐ | ⭐⭐⭐⭐⭐ | $$$ |
| JMP | ⭐⭐⭐⭐ | ⭐⭐⭐⭐⭐ | ⭐⭐⭐⭐ | ⭐⭐⭐⭐ | ⭐⭐⭐⭐⭐ | $$$$ |
| XLSTAT | ⭐⭐⭐⭐⭐ | ⭐⭐⭐⭐ | ⭐⭐⭐⭐ | ⭐⭐⭐⭐ | ⭐⭐⭐⭐⭐ | $$ |
| Google Data Studio | ⭐⭐⭐ | ⭐⭐⭐⭐⭐ | ⭐⭐⭐⭐ | ⭐⭐⭐⭐⭐ | ⭐⭐⭐⭐⭐ | Free |
Cost: $ = Inexpensive, $$ = Moderate, $$$ = Expensive, $$$$ = Premium
By understanding your specific needs and priorities, you can make an informed decision on the best statistical analysis software for your business.
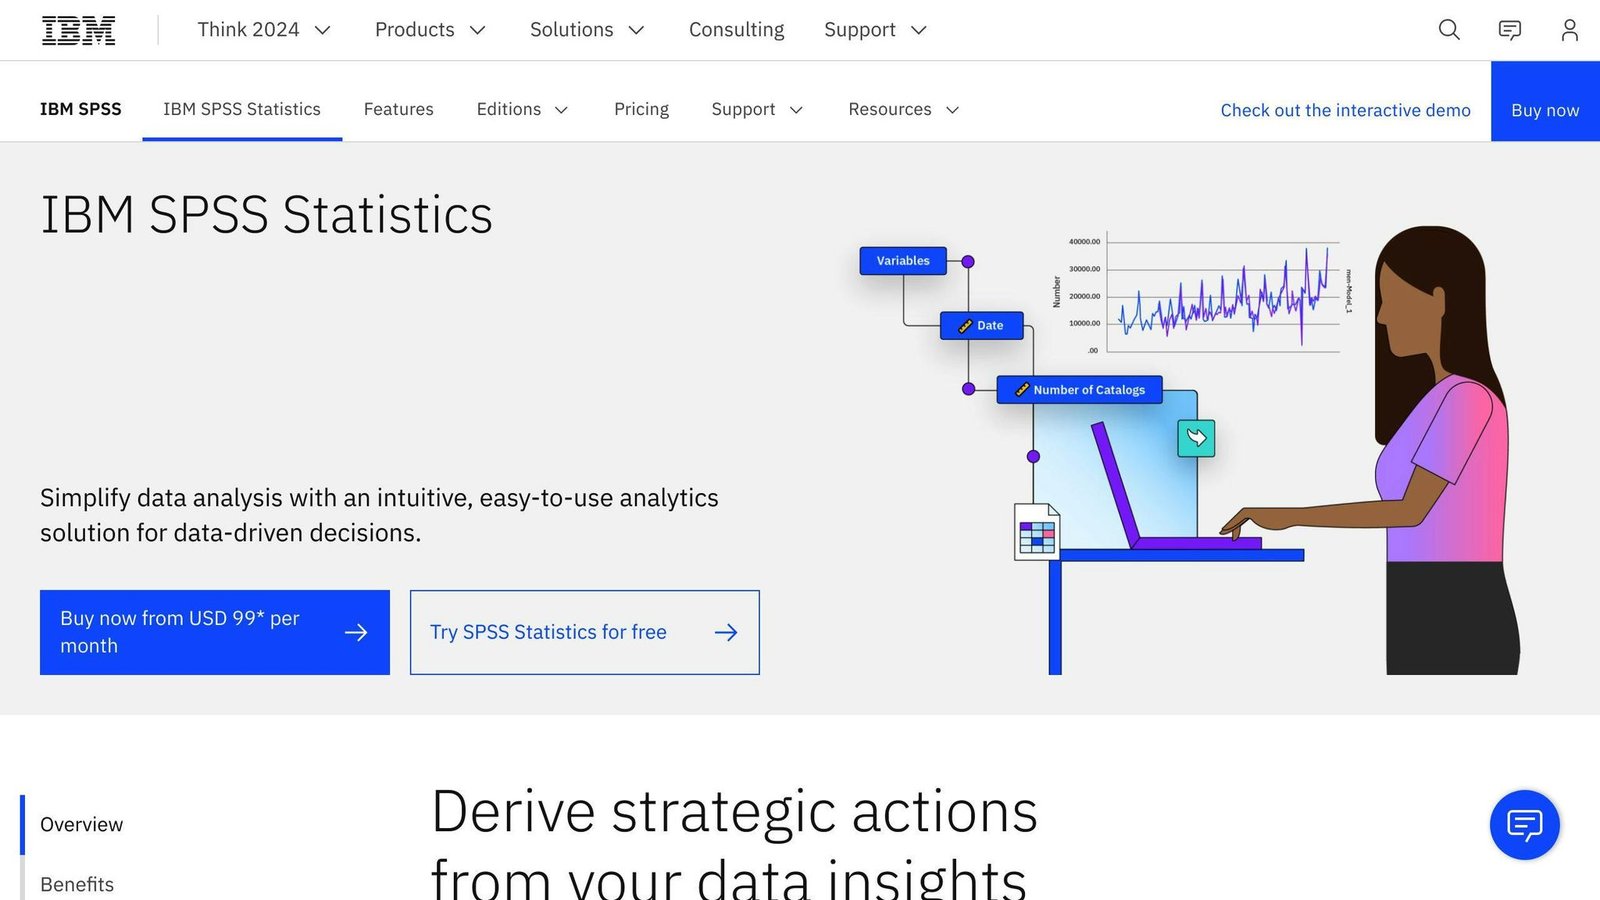
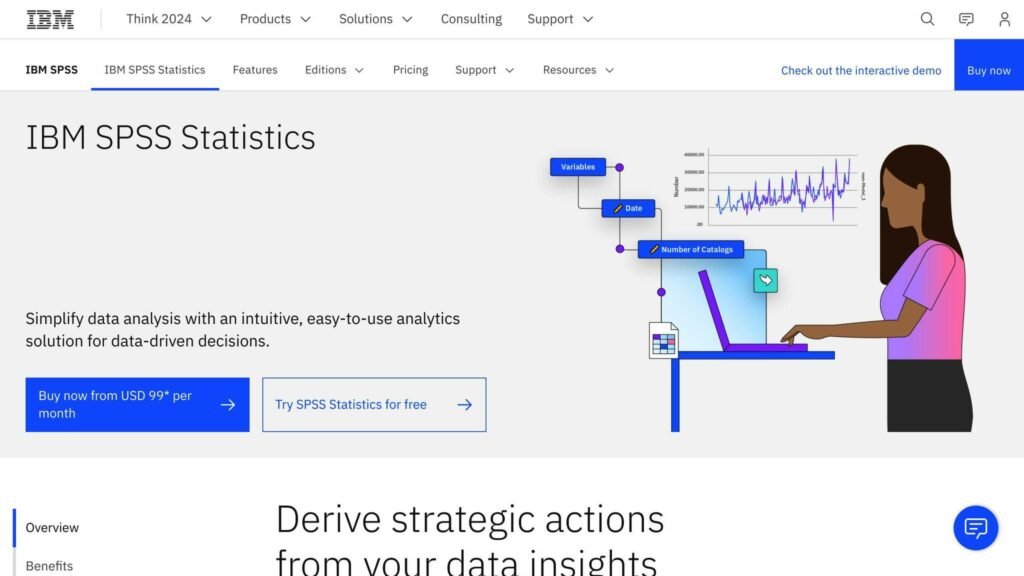
IBM SPSS Statistics is a powerful statistical analysis software that helps businesses make informed decisions. Its user-friendly interface makes it suitable for both novice and experienced analysts.
Data Analysis Capabilities
IBM SPSS Statistics offers a range of data analysis capabilities, including:
| Capability | Description |
|---|---|
| Descriptive Statistics | Summarize and describe data |
| Inferential Statistics | Make inferences about a population based on a sample |
| Predictive Analytics | Forecast future outcomes based on historical data |
| Machine Learning | Enable machines to learn from data and make decisions |
| Decision Trees | Visualize complex data relationships |
| Clustering | Group similar data points together |
Visualization Features
IBM SPSS Statistics provides various visualization features to present complex data insights clearly, including:
| Visualization | Description |
|---|---|
| Charts | Display data in a graphical format |
| Graphs | Show relationships between data points |
| Plots | Visualize data distributions and patterns |
| Interactive Visualizations | Explore data from different angles and identify patterns |
Integration & Scalability
IBM SPSS Statistics integrates seamlessly with other IBM products and supports various data sources, including:
| Integration | Description |
|---|---|
| IBM Watson Studio | Collaborative platform for data science |
| IBM Cognos Analytics | Business intelligence and analytics platform |
| Spreadsheets | Microsoft Excel, Google Sheets, etc. |
| Databases | Relational databases, cloud storage services, etc. |
The software is highly scalable, making it suitable for large-scale data analysis and enterprise-wide deployments.
User Experience
IBM SPSS Statistics is designed to be user-friendly, with an intuitive interface that makes it easy to navigate and use. The software provides a range of tutorials and resources to help users get started quickly.
Cost Considerations
IBM SPSS Statistics offers a range of pricing plans, including a free trial and various subscription options. While it may be more expensive than some competitors, its advanced features and capabilities make it a worthwhile investment for businesses that require robust statistical analysis capabilities.
Overall, IBM SPSS Statistics is a powerful and versatile statistical analysis software that offers a range of features and capabilities to help businesses make informed decisions. Its user-friendly interface, advanced analytics capabilities, and scalability make it a popular choice among data analysts and researchers.
2. MATLAB
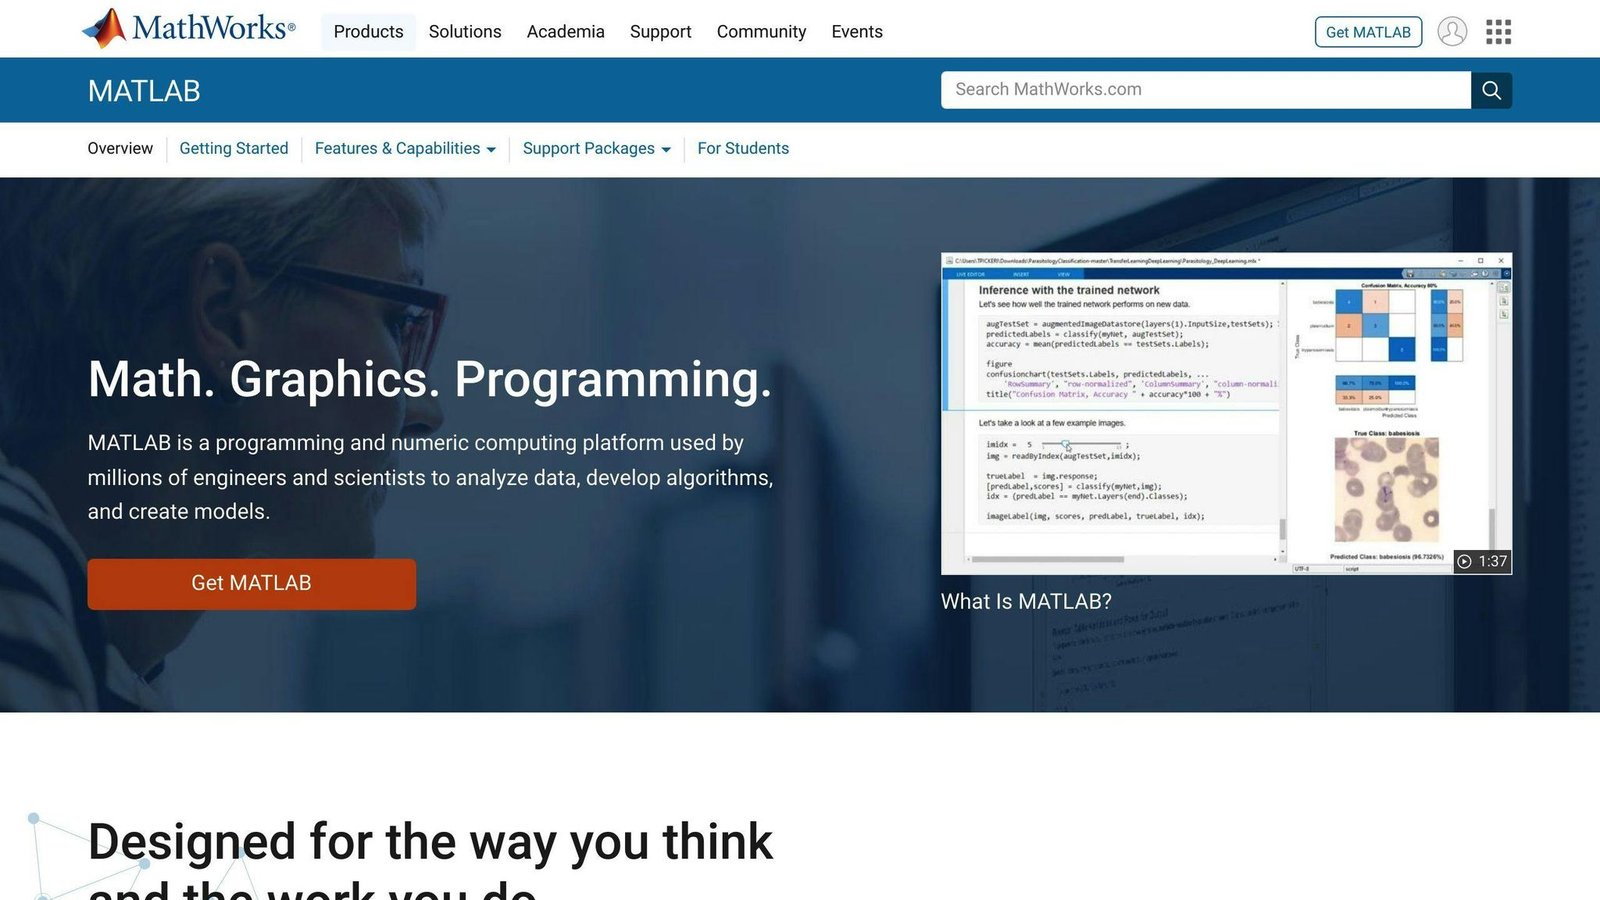
MATLAB is a powerful statistical analysis software that helps businesses make informed decisions.
Data Analysis Capabilities
MATLAB offers various data analysis capabilities, including:
| Capability | Description |
|---|---|
| Predictive Analytics | Forecast future outcomes based on historical data |
| Visual Analytics | Visualize complex data insights clearly |
| Multivariate Analysis | Analyze multiple variables and their relationships |
| Data Connectors | Connect to various data sources and import data |
| Association Discovery | Identify relationships between variables |
| Bayesian Analysis | Apply Bayesian methods to data analysis |
| Data Clustering | Group similar data points together |
| Regression Analysis | Model relationships between variables |
| Reporting & Statistics | Generate reports and perform statistical analysis |
| Statistical Process Control | Monitor and control statistical processes |
| Forecasting | Predict future outcomes based on historical data |
| Data Visualization | Visualize data to identify patterns and trends |
| Time Series Analysis | Analyze data with time-based variables |
| Search/Filter | Search and filter data to extract insights |
| Survival Analysis | Analyze data with time-to-event variables |
| Statistical Simulation | Simulate statistical models and scenarios |
User Experience
MATLAB is designed to be easy to use, with an intuitive interface that makes it easy to navigate and use. The software provides a range of tutorials and resources to help users get started quickly.
Cost Considerations
MATLAB offers a range of pricing plans, including a free trial and various subscription options. While it may be more expensive than some competitors, its advanced features and capabilities make it a worthwhile investment for businesses that require robust statistical analysis capabilities.
Overall, MATLAB is a powerful and versatile statistical analysis software that offers a range of features and capabilities to help businesses make informed decisions. Its user-friendly interface, advanced analytics capabilities, and scalability make it a popular choice among data analysts and researchers.
3. Stata
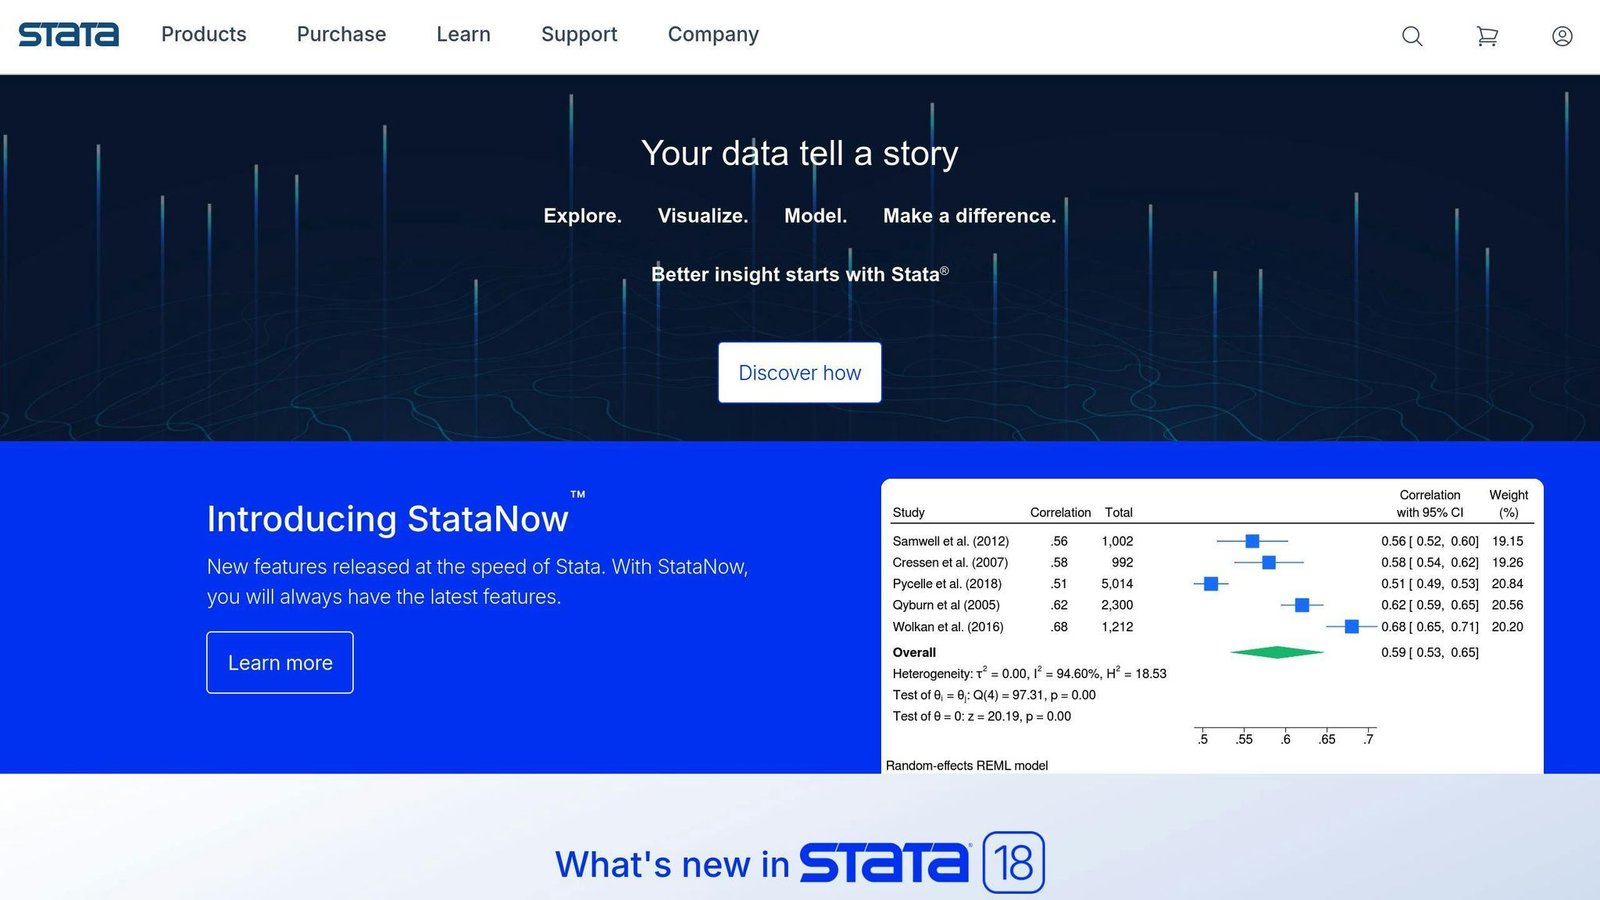
Stata is a statistical analysis software that offers a comprehensive suite of tools for data management, analysis, and visualization. With over 30 years of expertise in research and data science, Stata has established itself as a trusted solution for businesses across various disciplines.
Data Analysis Capabilities
Stata provides an extensive range of statistical features, including:
| Feature | Description |
|---|---|
| Linear Models | Analyze relationships between variables |
| Panel/Longitudinal Data | Work with data that tracks individual units over time |
| Multilevel Mixed-Effects Models | Model complex relationships between variables |
| Mata Programming Language | Process panel data, manipulate matrices, and optimize codes |
| Automated Reporting | Generate reports with ease |
User Experience
Stata’s menu-driven interface and help system make it easy to navigate and use, even for those without extensive statistical knowledge. The software also offers a command line interface for more experienced users. With a wide range of resources available, including tutorials and documentation, Stata provides a supportive environment for users to learn and grow.
Cost Considerations
Stata offers various pricing plans, including annual and perpetual licenses. While it may not be the most affordable option, its comprehensive features and capabilities make it a worthwhile investment for businesses that require robust statistical analysis capabilities.
4. Tableau
Data Analysis Capabilities
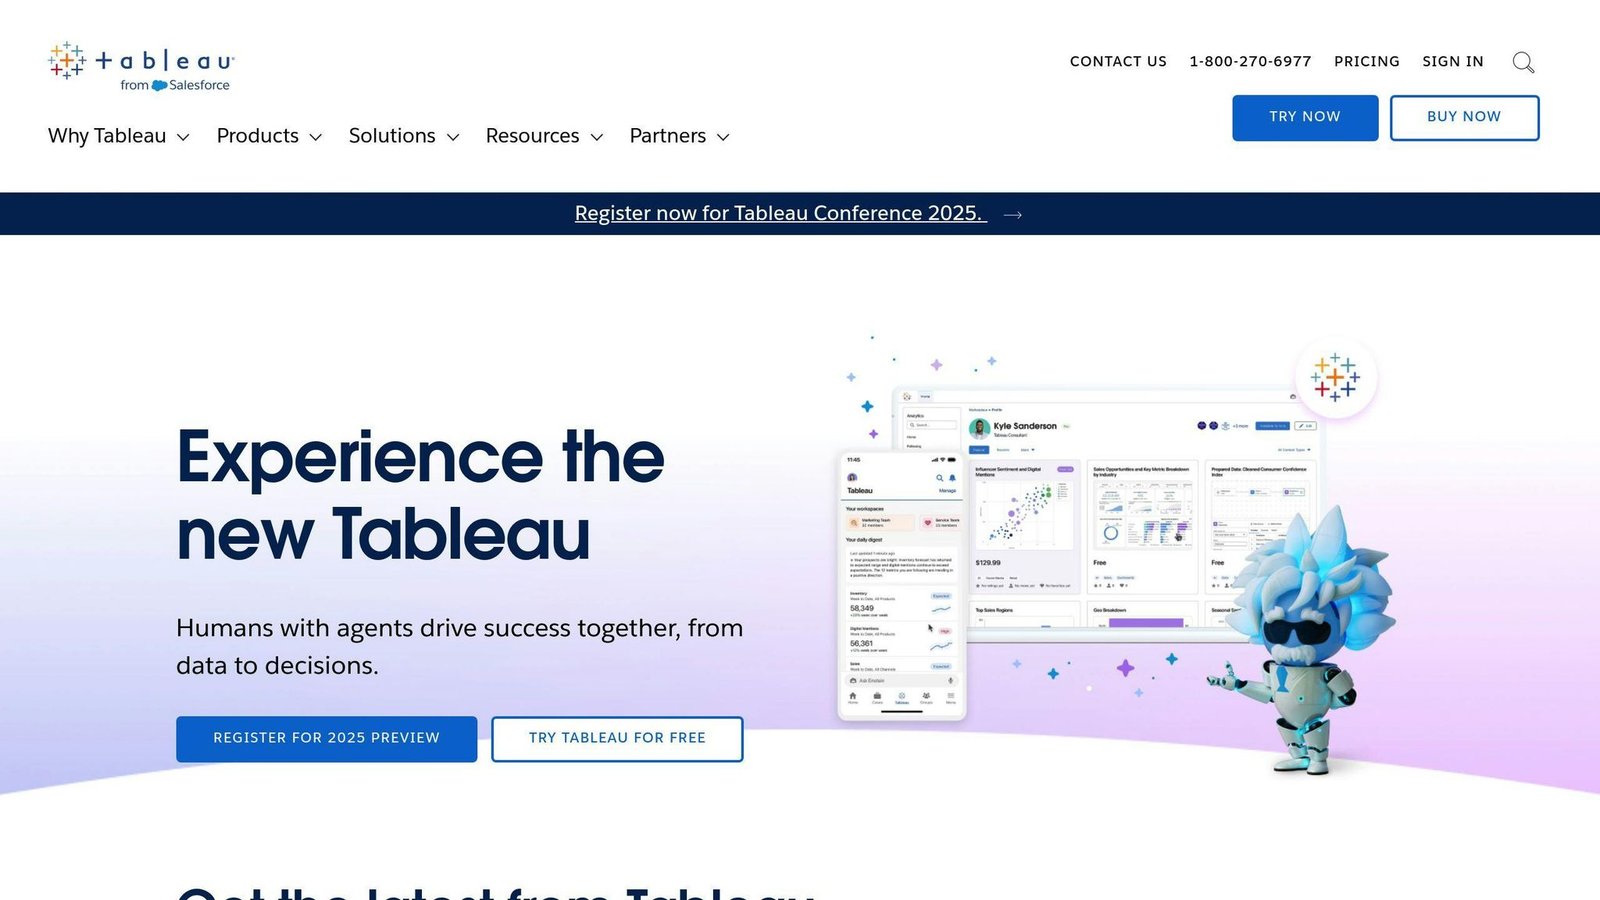
Tableau is a popular data visualization and analytics platform that offers a range of advanced data analysis capabilities. With Tableau, users can easily connect to various data sources, create interactive dashboards, and perform complex data analysis tasks.
| Capability | Description |
|---|---|
| Forecasting | Predict future outcomes based on historical data |
| Clustering | Group similar data points together |
| Regression Analysis | Model relationships between variables |
Visualization Features
Tableau’s visualization features are one of its strongest suits. The platform offers a wide range of visualization options, including maps, bar charts, pie charts, and more.
| Visualization | Description |
|---|---|
| Maps | Display geographic data |
| Bar Charts | Compare categorical data |
| Pie Charts | Show proportion of each category |
Integration & Scalability
Tableau integrates seamlessly with a range of data sources, including relational databases, cloud storage services, and big data platforms. Its scalability features make it an ideal tool for businesses of all sizes.
| Integration | Description |
|---|---|
| Relational Databases | Connect to databases like MySQL, PostgreSQL, etc. |
| Cloud Storage Services | Integrate with cloud storage services like AWS, Google Cloud, etc. |
| Big Data Platforms | Connect to big data platforms like Hadoop, Spark, etc. |
User Experience
Tableau’s user interface is highly intuitive and easy to use, even for users without extensive statistical knowledge.
Cost Considerations
Tableau no longer sells a standalone Creator plan at $70 per user per month. Its published tiers are Tableau Cloud Standard at $15 per user per month and Tableau Cloud Enterprise at $35 per user per month, both billed annually. Tableau Next is $40 per user per month, billed annually. Creator, Explorer and Viewer are now user roles inside those plans rather than separate products. Tableau Public is still free. Prices checked August 2026; confirm with Tableau before budgeting.
5. Minitab
Data Analysis Capabilities
Minitab is a powerful statistical analysis software that offers a range of data analysis capabilities. With Minitab, users can perform various statistical tests, including regression, ANOVA, and hypothesis testing. The software also provides tools for data visualization, including graphs, charts, and plots.
| Capability | Description |
|---|---|
| Regression Analysis | Analyze relationships between variables |
| ANOVA | Compare group means |
| Hypothesis Testing | Test hypotheses about population parameters |
| Data Visualization | Create graphs, charts, and plots to visualize data |
Visualization Features
Minitab’s visualization features help users quickly understand their data. The software offers a range of visualization options, including:
| Visualization | Description |
|---|---|
| Scatter Plots | Display relationships between two variables |
| Bar Charts | Compare categorical data |
| Histograms | Show continuous data distributions |
Integration & Scalability
Minitab integrates with various data sources, including:
| Integration | Description |
|---|---|
| Excel | Import data from Excel spreadsheets |
| CSV | Import data from CSV files |
| SQL Databases | Connect to SQL databases |
The software is also scalable, making it suitable for businesses of all sizes.
User Experience
Minitab’s user interface is easy to use, even for users without extensive statistical knowledge. The software provides tutorials and resources to help users get started.
Cost Considerations
Minitab does not publish rates. Its pricing page is an enquiry form, so the only way to get a number is to ask sales. The model is a subscription per named user, with add-on modules such as predictive analytics and healthcare sold separately on top of the base licence. Figures quoted for Minitab elsewhere on the web are second-hand and we could not source them from the vendor, so we have removed the ones this article used to carry. Checked August 2026.
Data Analysis Capabilities
GraphPad Prism is a powerful statistical analysis software that offers various data analysis capabilities. With GraphPad Prism, users can perform statistical tests, including nonlinear regressions, ANOVA, and t-tests. The software also provides tools for data visualization, including graphs, charts, and plots.
| Capability | Description |
|---|---|
| Nonlinear Regressions | Analyze complex relationships between variables |
| ANOVA | Compare group means |
| t-tests | Compare two groups |
| Data Visualization | Create graphs, charts, and plots to visualize data |
Visualization Features
GraphPad Prism’s visualization features help users quickly understand their data. The software offers various visualization options, including:
| Visualization | Description |
|---|---|
| Scatter Plots | Display relationships between two variables |
| Bar Charts | Compare categorical data |
| Histograms | Show continuous data distributions |
User Experience
GraphPad Prism’s user interface is easy to use, even for users without extensive statistical knowledge. The software provides online support, including guides and tutorials, to help users get started. Additionally, GraphPad Prism allows users to automate their workflows without programming, reducing time spent on analyzing and graphing experiments.
Cost Considerations
GraphPad publishes its rates. Prices below are per seat and were checked in August 2026; confirm them before budgeting.
| Plan | Unit and term | Cost |
|---|---|---|
| Personal subscription, corporate | 1 seat, per year | $520 |
| Personal subscription, academic | 1 seat, per year | $260 |
| Personal subscription, student | 1 seat, per year | $142 |
| Personal subscription, monthly option | 1 seat, per month | $50 |
| Group subscription, corporate | 5 seats, per year | $2,800 |
| Group subscription, academic | 5 seats, per year | $1,300 |
| Perpetual licence, Prism 11 corporate | 1 seat, one-off | $3,200 |
| Perpetual licence, Prism 11 academic | 1 seat, one-off | $1,600 |
Academic pricing requires affiliation with a degree-granting institution or registered nonprofit and academic-only use.
Note: The free trial option is also available, allowing users to test the software’s features before committing to a purchase.
7. OriginPro
Data Analysis Capabilities
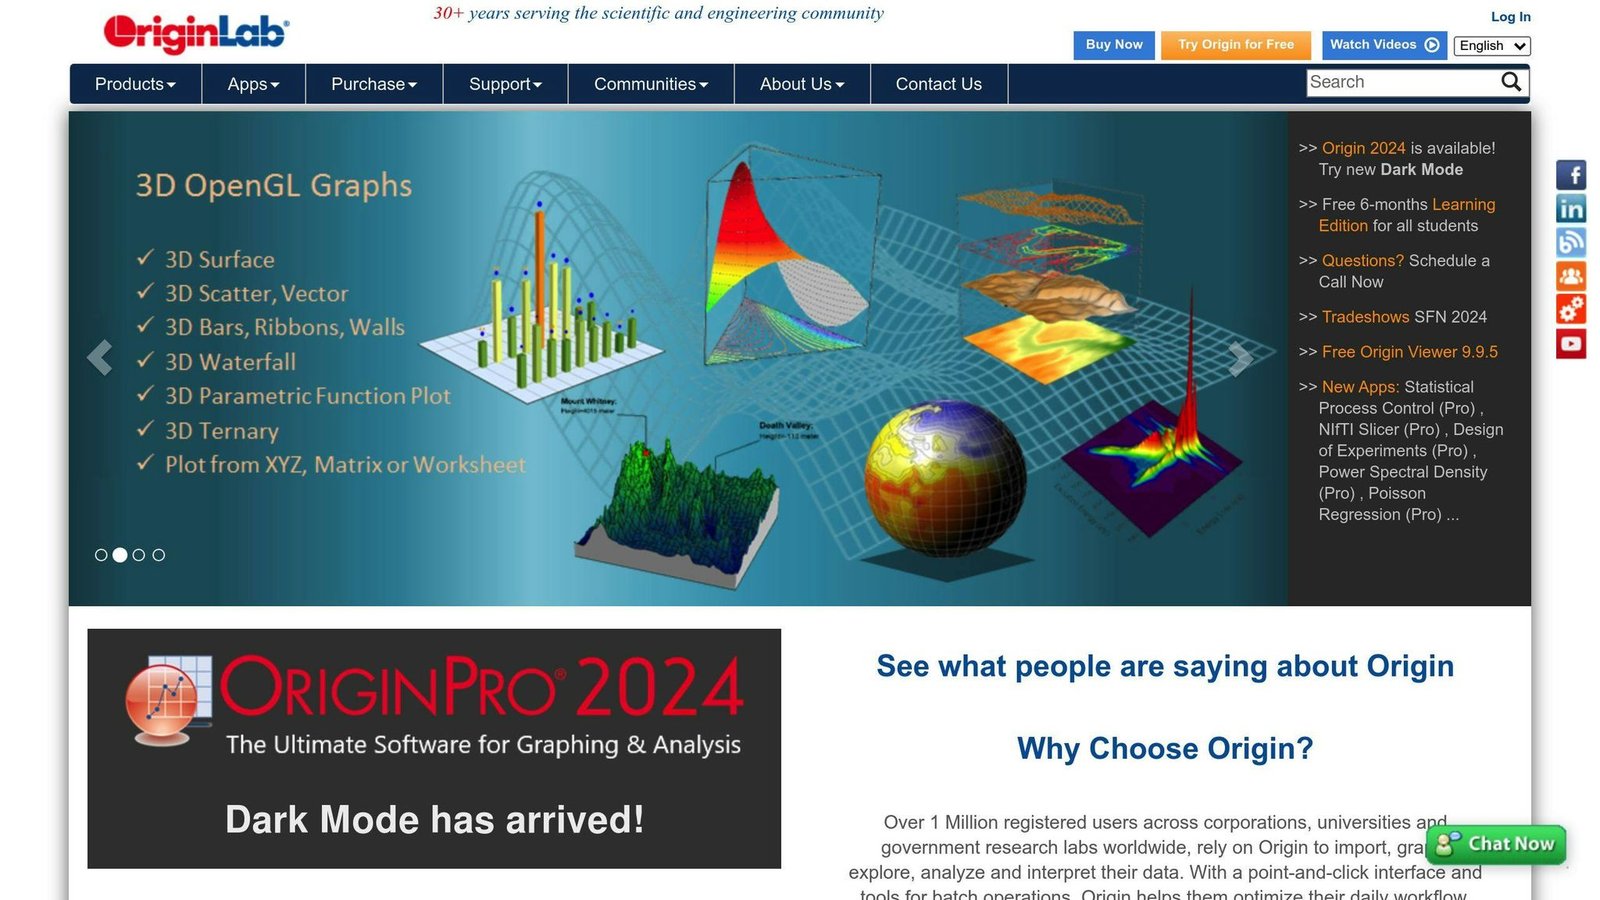
OriginPro is a powerful statistical analysis software that offers various data analysis capabilities. With OriginPro, users can perform statistical tests, including nonlinear regressions, ANOVA, and t-tests. The software also provides tools for data visualization, including graphs, charts, and plots.
| Capability | Description |
|---|---|
| Nonlinear Regressions | Analyze complex relationships between variables |
| ANOVA | Compare group means |
| t-tests | Compare two groups |
| Data Visualization | Create graphs, charts, and plots to visualize data |
Visualization Features
OriginPro’s visualization features help users quickly understand their data. The software offers various visualization options, including:
| Visualization | Description |
|---|---|
| Scatter Plots | Display relationships between two variables |
| Bar Charts | Compare categorical data |
| Histograms | Show continuous data distributions |
User Experience
OriginPro’s user interface is easy to use, even for users without extensive statistical knowledge. The software provides online support, including guides and tutorials, to help users get started. Additionally, OriginPro allows users to automate their workflows without programming, reducing time spent on analyzing and graphing experiments.
Cost Considerations
OriginLab sells Origin and OriginPro as node-locked individual licences, available either as an annual licence or as a perpetual licence, with the first year of maintenance included. Its commercial pricing page puts individual licences at “starting as low as $495”; OriginPro sits above plain Origin, and the exact figure depends on licence type, so check the OriginLab store for your case. Group, network and site licences are quoted rather than listed. There is no $99 monthly plan and we could not source the $660 annual figure this article used to quote, so both have been removed. Checked August 2026.
Note: The free trial option is also available, allowing users to test the software’s features before committing to a purchase.
8. JMP
Data Analysis Capabilities
JMP is a powerful statistical analysis software that offers various data analysis capabilities. With JMP, users can perform statistical tests, including predictive modeling and cross-validation. The software also provides tools for data visualization, including graphs, charts, and plots.
Visualization Features
JMP’s visualization features help users quickly understand their data. The software offers various visualization options, including:
| Visualization | Description |
|---|---|
| Interactive Dashboards | Display data in a customizable dashboard |
| Reports | Generate reports with data insights |
| Graphs | Visualize data to identify patterns and trends |
User Experience
JMP’s user interface is easy to use, even for users without extensive statistical knowledge. The software provides online support, including guides and tutorials, to help users get started. Additionally, JMP allows users to automate their workflows without programming, reducing time spent on analyzing and graphing experiments.
Cost Considerations
JMP offers various pricing plans, including a free trial option. The pricing is suitable for midsize and large companies, but may be expensive for small businesses.
Note: The cost and pricing plans may vary depending on the region and country.
9. XLSTAT
XLSTAT is a powerful statistical analysis software that offers various data analysis capabilities. With XLSTAT, users can perform statistical tests, including predictive modeling and cross-validation. The software also provides tools for data visualization, including graphs, charts, and plots.
Data Analysis Capabilities
XLSTAT offers a range of data analysis capabilities, including:
| Capability | Description |
|---|---|
| Association Discovery | Identify relationships between variables |
| Data Discovery | Explore and understand data |
| Forecasting | Predict future outcomes |
| Multivariate Analysis | Analyze multiple variables |
| Predictive Analytics | Make predictions based on data |
| Regression Analysis | Model relationships between variables |
| Reporting/Analytics | Generate reports and perform statistical analysis |
| Self-Service Analytics | Perform analysis without IT support |
| Statistical Process Control | Monitor and control statistical processes |
| Statistical Simulation | Simulate statistical models and scenarios |
| Survival Analysis | Analyze data with time-to-event variables |
| Time Series Analysis | Analyze data with time-based variables |
Visualization Features
XLSTAT’s visualization features help users quickly understand their data. The software offers various visualization options, including:
| Visualization | Description |
|---|---|
| Data Visualization | Visualize data to identify patterns and trends |
| Forecasting | Predict future outcomes |
| Multivariate Analysis | Analyze multiple variables |
User Experience
XLSTAT’s user interface is easy to use, even for users without extensive statistical knowledge. The software provides online support, including guides and tutorials, to help users get started. Additionally, XLSTAT offers a free trial option, allowing users to test the software before committing to a purchase.
Cost Considerations
The Basic, Basic+, Applied and Premium tiers this article used to list no longer exist. XLSTAT is sold by Lumivero and the current editions are Essentials, Standard and Advanced. Lumivero does not publish rates on the XLSTAT product page; you buy through its shop or ask for institutional pricing, and prices vary by region. Education and academic discounts are offered. We removed the old figures rather than carry numbers we could not source from the vendor. Checked August 2026.
Google Data Studio is a free, web-based platform that helps users create interactive, web-based data visualization reports. It connects with various data sources, including Google Analytics and Google Sheets.
Data Analysis Capabilities
Google Data Studio offers the following data analysis capabilities:
| Capability | Description |
|---|---|
| Data Blending | Combine data from multiple sources into a single report |
| Data Visualization | Create interactive, web-based reports with various chart types |
| Filtering | Apply filters to data to narrow down results and focus on specific insights |
Visualization Features
Google Data Studio’s visualization features help users quickly understand their data. The platform offers the following visualization options:
| Visualization | Description |
|---|---|
| Interactive Charts | Create interactive charts that allow users to hover over data points for more information |
| Conditional Formatting | Apply conditional formatting to highlight important data points or trends |
| Custom Themes | Create custom themes to match your brand’s style and aesthetic |
User Experience
Google Data Studio’s user interface is easy to use, even for users without extensive statistical knowledge. The platform provides online support, including guides and tutorials, to help users get started.
Cost Considerations
Google Data Studio is a free platform, with no costs or fees associated with its use. This makes it an attractive option for individuals and businesses looking to create interactive, web-based data visualization reports without incurring additional costs.
Key Features and Functions
When choosing statistical analysis software, it’s essential to consider the key features and functions that meet your needs. Here, we’ll explore the critical capabilities and visualization features of each software.
Data Analysis Capabilities
Top statistical analysis software offers various data analysis capabilities, including:
| Capability | Description |
|---|---|
| Data Blending | Combine data from multiple sources |
| Data Visualization | Create interactive reports with charts |
| Filtering | Apply filters to narrow down results |
| Regression Analysis | Analyze relationships between variables |
| Predictive Analytics | Forecast future outcomes |
| Statistical Process Control | Monitor and control processes |
Visualization Features
Effective visualization is crucial in statistical analysis. The top software offers various visualization features, including:
| Visualization | Description |
|---|---|
| Interactive Charts | Create interactive charts for data exploration |
| Conditional Formatting | Highlight important data points or trends |
| Custom Themes | Create custom themes for branding |
| Heat Maps | Visualize complex data relationships |
| Scatter Plots | Analyze relationships between two variables |
Shared Features
While each software has unique features, there are some shared features that are common across most statistical analysis software, including:
- Data connectors to import data from various sources
- Search and filter capabilities to narrow down data
- Reporting and statistics features to generate insights
- Integration with other tools and platforms for seamless workflows
By understanding the key features and functions of each software, you can make an informed decision about which tool best fits your needs.
Integration, Scalability, and User Experience
When choosing the best statistical analysis software, it’s essential to consider three key factors: integration, scalability, and user experience.
Integration with Other Tools and Systems
Statistical analysis software should integrate seamlessly with other tools and systems to facilitate efficient data analysis. Here’s how some popular software integrates with other tools:
| Software | Integration |
|---|---|
| Minitab | Microsoft Excel |
| Stata | SQL databases, cloud storage services |
| IBM SPSS Statistics | IBM Watson Studio, other IBM products |
Scalability Options
Scalability is critical when dealing with large datasets and complex analyses. Here’s how some popular software scales:
| Software | Scalability |
|---|---|
| MATLAB | Handles large datasets, high-performance computing |
| Tableau | Cloud-based deployments, enterprise-wide implementations |
User Experience
The user experience is vital in statistical analysis software. You want software that is easy to learn and use, with an intuitive interface and minimal learning curve. Here’s how some popular software fares:
| Software | User Experience |
|---|---|
| Minitab | User-friendly interface, interactive visualizations, step-by-step guides |
| Stata | Intuitive interface, comprehensive help system, online resources |
| IBM SPSS Statistics | Tutorials, online resources, easy to get started |
By considering these three factors, you can make an informed decision about which software best fits your needs and ensures efficient data analysis and visualization.
Cost Comparison
When choosing statistical analysis software, cost is a crucial factor to consider. The cost of statistical analysis software can vary greatly, depending on the type of license, user count, and features required. Here’s a breakdown of the cost considerations for each software:
Entry-Level Pricing
Only some of these vendors publish a list price. Where they do not, we say so rather than repeat a figure from a third-party site. Checked August 2026; confirm before budgeting.
| Software | Entry-level pricing |
|---|---|
| IBM SPSS Statistics | Not published. Subscription, perpetual, campus and student licences exist, but IBM routes you to a purchase advisor for rates. |
| MATLAB | $940 per year for the Standard individual licence, which bundles MATLAB, Simulink and add-ons. Other licence types are quote-only. |
| Stata | Priced per edition (BE, SE, MP) and per country, annual or perpetual. A Stata/MP4 annual download licence is listed at $995. Business and academic rates differ; check the order page for your edition. |
| Tableau | $15 per user per month, Cloud Standard, billed annually. |
| Minitab | Not published. Enquiry form only. |
| GraphPad Prism | $520 per seat per year, corporate personal subscription; $260 academic. |
Enterprise-Level Pricing
| Software | Enterprise-Level Pricing |
|---|---|
| IBM SPSS Statistics | Custom pricing for large-scale deployments |
| MATLAB | Custom pricing for large-scale deployments |
| Stata | Custom pricing for large-scale deployments |
| Tableau | Custom pricing for large-scale deployments |
| Minitab | Custom pricing for large-scale deployments |
| GraphPad Prism | Custom pricing for large-scale deployments |
Additional Costs to Consider
In addition to the initial license cost, there may be additional costs to consider, such as:
- Maintenance and upgrade fees
- Training and support costs
- Customization and integration fees
- Data storage and processing costs
It’s essential to factor these costs into your overall budget to ensure you’re getting the best value for your investment.
By considering the entry-level pricing, enterprise-level pricing, and additional costs, you can make an informed decision about which statistical analysis software best fits your budget and meets your needs.
Pros and Cons
When choosing the best statistical analysis software, it’s essential to consider the advantages and disadvantages of each option. Here’s a summary of the pros and cons of each software:
IBM SPSS Statistics
| Pros | Cons |
|---|---|
| Easy to use | Costly, especially for individual users |
| Advanced statistical methods | Steep learning curve for beginners |
| High-quality reporting and data visualization | Limited customization options |
MATLAB
| Pros | Cons |
|---|---|
| Highly customizable | Steep learning curve for beginners |
| Advanced data analysis and visualization | Expensive, especially for individual users |
| Integrates well with other tools | Not ideal for simple data analysis tasks |
Stata
| Pros | Cons |
|---|---|
| Easy to use | Costly, especially for individual users |
| Advanced statistical methods | Limited customization options |
| High-quality reporting and data visualization | Not ideal for simple data analysis tasks |
Tableau
| Pros | Cons |
|---|---|
| Easy to use | Limited statistical analysis capabilities |
| Advanced data visualization | Expensive, especially for individual users |
| Integrates well with other tools | Not ideal for complex data modeling tasks |
Minitab
| Pros | Cons |
|---|---|
| Easy to use | Costly, especially for individual users |
| Advanced statistical methods | Limited customization options |
| High-quality reporting and data visualization | Not ideal for simple data analysis tasks |
When choosing the best statistical analysis software, consider your specific needs and priorities. If you’re looking for ease of use and advanced features, IBM SPSS Statistics or Stata may be the best choice. If you need high customization options, MATLAB may be the way to go. If you’re looking for advanced data visualization capabilities, Tableau is a great option. Ultimately, the best software for you will depend on your specific requirements and budget.
Summary
In this article, we explored the top 10 statistical analysis software options. Each tool has its strengths and weaknesses, catering to different business needs and priorities.
Choosing the Right Software
When selecting statistical analysis software, consider the following factors:
| Factor | Description |
|---|---|
| Ease of use | How easy is the software to learn and use? |
| Advanced statistical methods | Does the software offer advanced statistical methods? |
| Data visualization capabilities | Can the software create interactive and informative visualizations? |
| Integration with other tools | Does the software integrate well with other tools and platforms? |
| Cost | What is the total cost of ownership, including maintenance and support? |
Key Takeaways
By understanding your organization’s specific needs and priorities, you can make an informed decision that drives business growth and informed decision-making. The best statistical analysis software for your business will depend on your unique requirements, budget, and goals.
Remember to weigh the pros and cons of each option and consider your organization’s needs before making a decision.
FAQs
Which tool is best for statistical analysis?
The best tool for statistical analysis depends on your specific needs and goals. Here’s a brief comparison:
| Tool | Strengths |
|---|---|
| IBM SPSS Statistics | Advanced statistical methods, comprehensive solution |
| Tableau | Data visualization, interactive dashboards |
| Domo | Best dashboards, Salesforce integration |
| SAS Viya | Cross-department tool, advanced analytics |
| Scilab | Open-source, free alternative |
| JMP | Mac-friendly, user-friendly interface |
| Minitab | Easy to use, high-quality reporting |
Choose the tool that best fits your team’s skill set, budget, and goals.
Which software is best for statistical analysis?
The best software for statistical analysis depends on your specific needs and priorities. Here’s a brief comparison:
| Software | Strengths |
|---|---|
| IBM SPSS Statistics | Large teams, different skill sets |
| Tableau | Salesforce users, data visualization |
| Domo | Best dashboards, business intelligence |
| SAS Viya | Cross-department, advanced analytics |
| Scilab | Open-source, free alternative |
| JMP | Mac users, user-friendly interface |
| Minitab | Easy to use, high-quality reporting |
Consider your specific needs and priorities to choose the best software for your business.
More on this topic
Browse all 53 articles on Data & Analytics.