As part of a comprehensive ETL process, error logging keeps data pipelines running by making failures visible and diagnosable. Without it, errors turn into silent bad data and expensive downtime. Here’s what you need to know.
A note on numbers: this article previously carried around twenty percentage claims about incident volumes, resolution speeds and error-reduction rates. None of them cited a source we could trace, so they have been removed rather than repeated. The practices below are still worth adopting; we just cannot tell you they will cut your failures by a specific percentage, and neither can anyone else without measuring your pipelines.
- Key Practices:
- Use structured logs with levels like DEBUG, INFO, WARN, and ERROR to prioritize issues.
- Include metadata (timestamps, IDs) for better diagnostics.
- Standardize formats (e.g., JSON) for easier analysis.
- Error Handling:
- Real-time monitoring tools like Grafana or CloudWatch catch issues early.
- Tiered alerts ensure critical errors get immediate attention while minor ones can wait.
- Retry logic with exponential backoff handles transient failures without human involvement.
- Data Isolation:
- Dead-letter queues and error tables prevent bad data from affecting clean datasets.
- Quarantine zones allow safe correction and reintegration of flawed records.
Good ETL error logging reduces downtime and manual troubleshooting. Start with structured logging, real-time monitoring, and automated handling.
How to Structure ETL Logs
Structured logs turn hours of troubleshooting into minutes, mainly because you can filter and query them instead of reading them.
Log Levels and Categories
Log levels act like a triage system for your ETL pipeline, helping you prioritize and manage log data. Here’s how they work:
- DEBUG: Captures detailed diagnostics, like variable states or loop iterations. Useful for development but too verbose for production.
- INFO: Tracks the general flow of operations, such as “Start Extract Session” or “Load completed.”
- WARN: Flags non-critical issues, like “Null values found in non-mandatory field” or “Rate limit approaching.”
- ERROR: Highlights critical failures that demand immediate attention, such as “Transformation failed due to invalid schema” or “Connection timeout”.
Proper log levels save time by letting you filter out everything irrelevant to the problem in front of you. During an outage, going straight to ERROR-level logs is faster than scrolling. Stage-specific logging adds precision:
- During extraction, log details like source file names, record counts, and file sizes.
- For transformation, capture data validation errors and memory usage.
- During loading, record target locations and compare successful vs. failed record loads.
Adding Contextual Metadata
Contextual metadata is what makes a log entry diagnostic rather than decorative. Each entry should include:
- Precise timestamps with millisecond accuracy, formatted as
YYYY-MM-DDTHH:MM:SSZ. - Unique identifiers like run IDs, process IDs, and stage-specific details (e.g., source file names or target table names).
- A traceable ID combining the pipeline name, partition, and execution timestamp (e.g.,
CustomerETL_2026-04-21_143052).
“Capturing metadata is critical, as data pipelines can fail for many reasons. Knowing the exact inputs that caused a failure is essential to implementing a proper fix.” – startdataengineering.com
That metadata is what lets an engineer reproduce a failure instead of guessing at it. Correlation IDs, which track a record across pipeline stages, are the single most useful addition for tracing where something went wrong. Timestamp analysis also surfaces performance problems – an extraction step that quietly moves from 5 seconds to 50 seconds is telling you something before it fails outright.
Using Standardized Logging Formats
Standardizing log formats makes logs analyzable. JSON is the common choice for ETL logging because it is machine-readable and works directly with tools like the ELK Stack, Splunk, and Datadog. Unlike plaintext logs, which need regex parsing, JSON lets you filter on fields like service_nameor error_code.
Each log entry should carry a consistent set of fields: timestamp, log_level, message, service_name, and process_id. Use established logging libraries such as Log4j (Java/Scala), Winston (Node.js), or structlog (Python). Avoid manual string formatting or print statements, which become bottlenecks in distributed systems like Apache Spark. Enforce the standard through cluster policies or configuration templates, or it will drift.
Error Handling and Notification Strategies
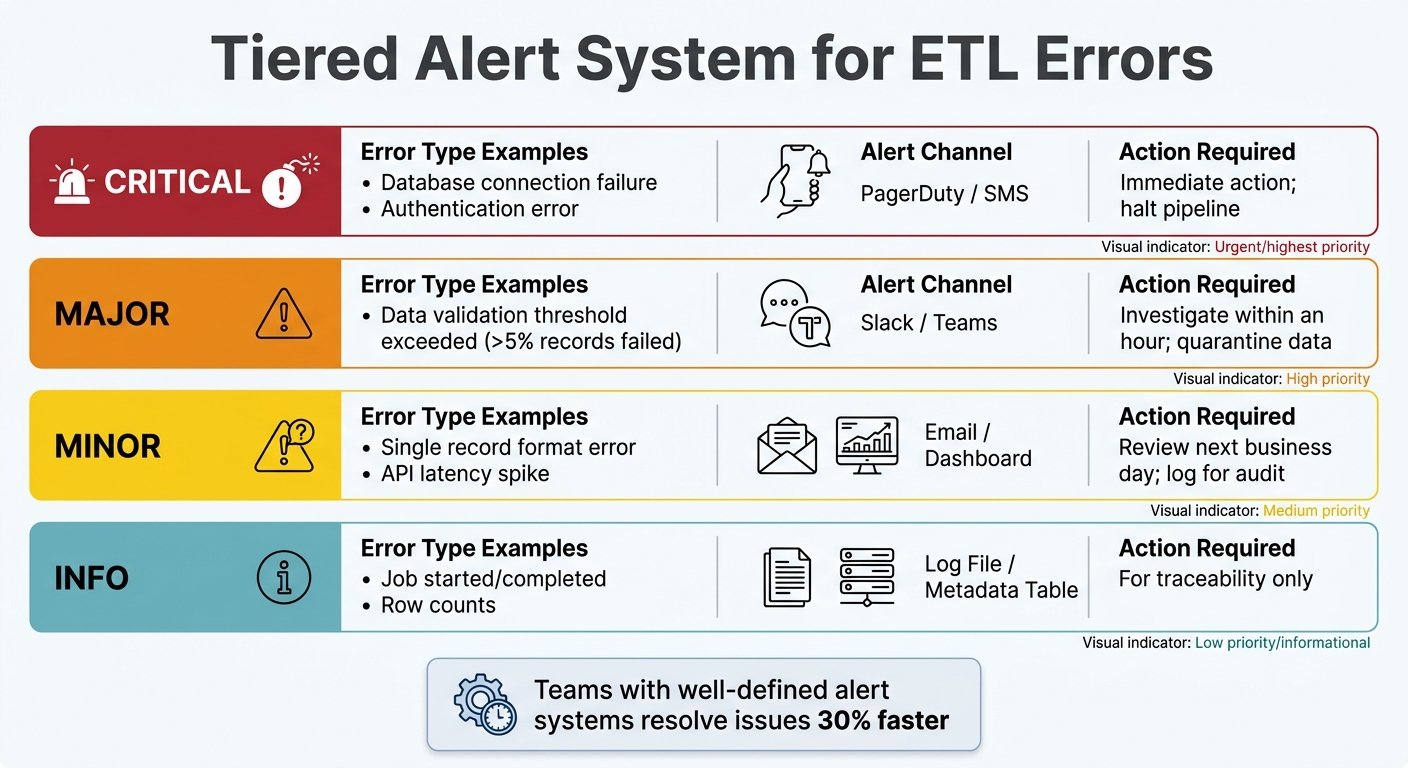
ETL Error Logging Alert Severity Levels and Response Actions
Catching an error is the first step; the response determines whether a glitch becomes an incident.
Real-Time Error Monitoring
Real-time monitoring means watching your pipeline’s health as data flows, rather than waiting for someone to notice a missing report. Tools like Prometheus, Grafana, and AWS CloudWatch track throughput, latency, error rates, and resource usage. Monitor data freshness too: check the maximum event timestamp in your target tables, because a pipeline can report “success” while delivering data that is hours stale.
“ETL pipelines are the plumbing of the data stack. They are invisible when working correctly and catastrophic when they break.” – Nawaz Dhandala, OneUptime
Monitor at both the row level (null values, type mismatches) and the dataset level (volume drops, completeness issues) – each catches failures the other misses. Use seasonality-aware detectors so predictable traffic spikes do not generate alerts, which is how teams end up ignoring the alert channel entirely.
Setting Up Tiered Alert Systems
Not every error justifies a middle-of-the-night wake-up call. A tiered system routes notifications by severity.
| Severity Level | Error Type Example | Alert Channel | Action Required |
|---|---|---|---|
| Critical | Database connection failure, authentication error | PagerDuty / SMS | Immediate action; halt pipeline |
| Major | Data validation threshold exceeded (>5% records failed) | Slack / Teams | Investigate within an hour; quarantine data |
| Minor | Single record format error, API latency spike | Email / Dashboard | Review next business day; log for audit |
| Info | Job started/completed, row counts | Log File / Metadata Table | For traceability only |
Trigger alerts only on meaningful deviation – a job taking 50% longer than its own baseline, or failing three times in a row. Colour-code messages in Slack for quick visual context. Automate escalation so administrators are notified only when thresholds are actually met.
Implementing Retry Logic for Temporary Errors
Transient failures – network timeouts, API rate limits, database deadlocks – are the class of error worth automating away, because retrying genuinely fixes them. Use exponential backoff, starting at intervals of 1 second, 2 seconds, 4 seconds and so on.
To avoid the “thundering herd” effect of simultaneous retries, add random jitter of 0–25% to the backoff times. Set a maximum retry count by task priority: around 5 attempts for critical transformations, 3–5 for standard jobs, 1–2 for low-priority tasks. When retries are exhausted, send the record to a dead-letter queue (DLQ) so one bad row does not halt the pipeline.
Design pipelines to be idempotent, so rerunning the same input does not create duplicates. Use partition-based overwrites (DELETE followed by INSERT within a transaction) rather than appending.
Data Isolation and Quarantine Techniques
When errors get past monitoring and retries, isolating the offending records stops flawed data contaminating clean datasets or breaking downstream jobs.
Using Error Tables and Dead-Letter Queues
Dead-letter queues (DLQs) and error tables both hold failed records. DLQs are standard in messaging and streaming systems like Kafka or AWS SQS; error tables are used in platforms like Snowflake to capture rows that fail during ingestion. Both retain the original data plus metadata, which is what makes diagnosis possible.
“Error logging gives you a SQL-queryable dead-letter queue built into Snowflake. Every row that fails during Snowpipe Streaming ingestion is automatically captured so you can see what failed, why it failed and take steps to fix it.” – Andrey Zagrebin, Staff Software Engineer, Snowflake
Systems such as Snowpipe Streaming can redirect failed rows to error tables automatically, so valid data keeps loading. Check the current Snowflake documentation for the exact parameter and syntax to enable it – an earlier version of this article quoted a specific setting we could not confirm against the vendor’s docs, so it has been removed.
Keep an eye on the proportion of your throughput landing in the DLQ; a rising share is a signal in itself. Alert on DLQ backlog thresholds and on sudden spikes in the failure rate. You can also automate common fixes – creating streams on error tables to trigger tasks that resolve predictable problems like type mismatches, then reprocess the corrected data.
Setting Up Quarantine Areas for Data Validation
Quarantine zones give you a controlled space to analyze and correct invalid records before they re-enter the pipeline, isolating flawed data while valid records flow through. Always store the original, unaltered payload exactly as received – without it, you cannot reliably reproduce or replay the failure.
Categorize errors as “Transient” (network timeouts, suitable for automated retry) or “Permanent” (schema violations, requiring a human). Use SQL-queryable storage so the team can find failure patterns with ordinary queries rather than reading files.
Build a “replay” mechanism to reintroduce corrected data into the main flow. Watch how long records sit in quarantine – for critical streams, a review target measured in hours rather than weeks keeps the backlog honest. Set a Time to Live (TTL) on quarantined data to control storage costs and meet retention requirements.
Monitoring and Resolving Issues
After isolating problematic data, the job is stopping it recurring.
Detecting Anomalies in ETL Workflows
Useful anomaly detection depends on thresholds derived from your own history, not from generic advice. A common pattern is to warn at around 80% of a normal operating bound and alert critically at around 95%, tuned against your baseline.
Four metric families are worth monitoring:
- Pipeline execution: success and failure rates.
- Data quality: row counts and data freshness.
- Performance: job durations and throughput.
- Resource utilization: CPU and memory usage.
A job that normally takes 20 seconds and suddenly takes 60, or CPU sitting above 85%, is worth investigating before it fails.
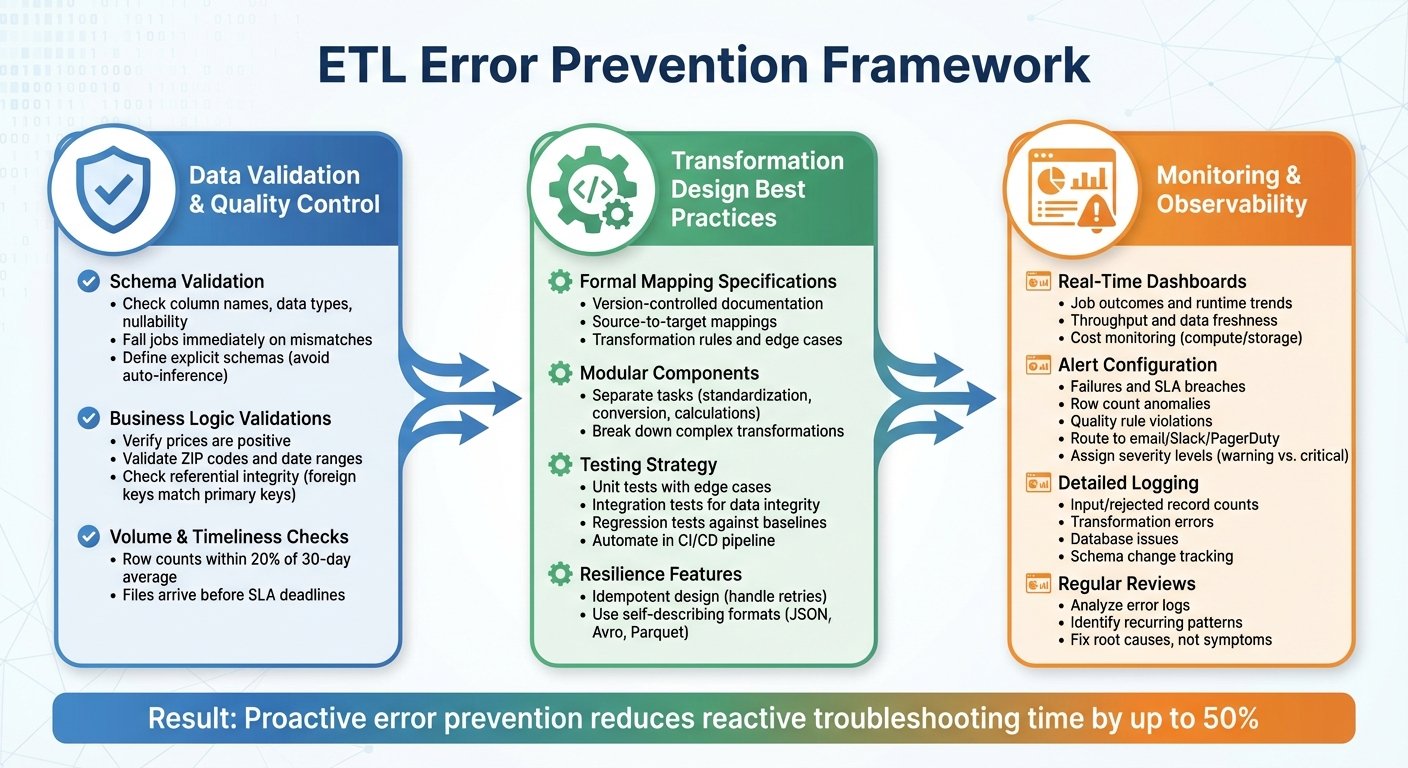
Schema drift – column names, data types or table structures changing upstream without warning – is one of the most common causes of pipeline breakage. Automated validation tools like Great Expectations or Deequ can produce delta reports and alert when the shape of incoming data changes.
Performing Root Cause Analysis of Recurring Errors
Recurring errors are the ones that actually cost you, because each recurrence consumes engineering time. The “5 Whys” method – asking “why” repeatedly until you reach a cause you can change – is a cheap and effective way to get past the symptom.
Correlation IDs speed this up considerably, since they let you trace a single record through every stage and see exactly where it went wrong.
After any major failure, run a formal post-mortem: what happened, why, and what change prevents it. Update remediation playbooks off the back of it. A post-mortem that produces no change to a playbook or a test was a meeting, not an analysis.
Tracking and Improving Data Quality
Ongoing quality tracking should happen at two levels:
- Row-level validation: null values, incorrect formats, field length violations.
- Dataset-level validation: total row counts and data volume consistency.
Set thresholds that suit your tolerance for error and then hold to them. Reasonable starting points many teams use: alert when the error rate exceeds 1% of a batch or when a task needs more than two retries; treat data more than two hours behind as stale; expect source-to-target row counts to align within a fraction of a percent; and keep nulls in key fields such as timestamps and identifiers close to zero. Tune all of these against your own baseline – they are starting points, not benchmarks.
Validating at both source and destination catches errors that a single checkpoint misses, which is the main argument for doing the extra work.
Conclusion
ETL error logging is not about tracking failures for their own sake – it is about keeping your business operations running on data you can trust. Gartner puts the cost of poor data quality at at least $12.9 million a year on average per organization, based on its 2020 research. That is the scale of what error handling is protecting against, and it is the one figure in this article we could trace to its source.
The practices above come down to structured logging, validation at multiple levels, and automated alerting. Start with the basics: standardize on JSON, use dead-letter queues to isolate problem records, and implement retries with exponential backoff. Make your pipelines idempotent so reprocessing does not duplicate data.
Then measure your own before-and-after. Any vendor or article quoting you a specific percentage improvement – including the figures previously published here – is not describing your pipelines. The only numbers worth planning against are the ones from your own monitoring.
FAQs
What should every ETL error log entry include?
Every ETL error log entry needs enough detail to diagnose the failure without rerunning it. Capture:
- Error type: Clearly specify the nature of the error (e.g., missing data, transformation failure).
- Severity: Indicate how serious the error is and whether it requires immediate attention.
- Impact: Outline the effect of the error on the ETL process or downstream systems.
- Timestamp: Record the exact date and time the error occurred.
- Contextual information: Affected data rows, process IDs, and the original payload.
How do I set alert thresholds without alert fatigue?
Concentrate on critical issues by setting thresholds that reflect genuine problems rather than normal variation. Use tiered alerts – warnings for less urgent matters, paging for serious errors. Review and tune the thresholds against historical data regularly. An alert channel people have learned to ignore is worse than no alert channel.
When should I use a dead-letter queue vs an error table?
A dead-letter queue (DLQ) holds messages or records that could not be processed after several retries, isolating them for inspection or reprocessing without stopping the system. An error table is a database table that logs detailed error information – validation or transformation failures – which you can query and join against your data. DLQs suit message-based and streaming systems; error tables suit structured error tracking in relational and warehouse platforms. Plenty of pipelines use both.
More on this topic
Browse all 53 articles on Data & Analytics.