Messaging analytics is the process of collecting and analyzing data from messaging campaigns across channels like SMS, push notifications, in-app messages, chatbots, email, and social media. By tracking key metrics, businesses can optimize their messaging strategies and drive better customer engagement and conversion.
Key Metrics to Track
Engagement Metrics
- Open Rates: Percentage of recipients who opened your messages. Available on email and push, not on SMS, and less reliable than it looks — see the warning below.
- Click-Through Rates (CTR): Percentage who clicked links or calls-to-action in messages
- Response Rates: Percentage who replied to messages
Conversion Metrics
- Conversion Rates: Percentage who took a desired action (e.g., made a purchase)
- Lead Generation: Number of new leads generated
- Revenue Attribution: Revenue generated from messaging campaigns
Retention Metrics
- Unsubscribe Rates: Percentage who opted out of receiving messages
- Churn Rates: Percentage who stopped engaging with your brand
- Customer Lifetime Value (CLV): Total value of a customer over their relationship with your brand
Sentiment Analysis
- Sentiment Scores: Measure of the emotional tone (positive, negative, or neutral) in responses
- Emotion Detection: Identification of specific emotions like happiness or frustration
- Topic Analysis: Identification of common topics or themes in responses
The Open Rate Warning
Email open rates have been unreliable since Apple introduced Mail Privacy Protection in 2021. It pre-loads tracking pixels whether or not the recipient reads the message, which registers an open that never happened. Anyone using Apple Mail with the feature on is counted as opening everything you send them.
Two consequences. First, your absolute open rate is inflated by an unknown amount that depends on your list’s device mix. Second, comparing your open rate to a published industry benchmark is meaningless, because that benchmark carries its own unknown inflation. Use opens for relative comparison within your own list over a stable period, and make decisions on clicks, replies and conversions instead.
SMS has no open rate at all. There is no pixel and no read receipt. If a tool reports an SMS open rate, ask what it is actually counting — usually it is a click on a shortened link.
Types of Messaging Channels
Businesses use different channels to communicate with customers. Each channel has its own strengths and uses. Here are some common messaging channels:
SMS Marketing
SMS marketing sends text messages to customers’ phones. It’s popular because many people open and read text messages quickly. Businesses use SMS for promotions, reminders, and alerts. They can send personalized messages to increase customer engagement and sales. SMS is also the channel with the heaviest consent rules, and it costs money per message, so a bad send is expensive twice over.
Push Notifications
Push notifications are messages sent to mobile apps. They allow businesses to reach customers even when the app isn’t open. They’re useful for re-engaging users, promoting new features, and sending personalized offers. To get more people to allow push notifications, businesses can offer incentives like exclusive content or discounts.
In-App Messages
In-app messages appear within a mobile app. Businesses can send targeted messages, recommendations, and guidance based on how the user interacts with the app. These messages can be triggered by specific user actions, like making a purchase or reaching a milestone.
Chatbots
Chatbots are automated messaging systems. They answer common questions and handle simple tasks at any hour. To evaluate chatbot performance, track resolution rate and, more importantly, escalation rate — the share of conversations a human has to take over. A bot with a high containment rate and a rising complaint volume is not working, it is trapping people.
Email Marketing
Email marketing is a traditional messaging channel that’s still effective. Businesses use email to send targeted campaigns, newsletters, and promotions to customers. Key metrics include click-through rates and conversion rates, plus open rates read with the caveat above.
Social Media Messaging
Social media messaging involves communicating with customers through platforms like Facebook Messenger, WhatsApp, and Instagram. It’s useful for customer support, answering questions, and building brand awareness. Businesses track metrics like response rates, resolution rates, and customer satisfaction. Note that these platforms restrict outbound marketing messages and charge for some message categories; read the current platform policy before designing a campaign around one.
| Channel | Use Cases | Key Metrics |
|---|---|---|
| SMS Marketing | Promotions, reminders, alerts | Delivery rate, click rate, reply rate, opt-out rate. No open rate exists. |
| Push Notifications | Re-engaging users, new features, personalized offers | Opt-in rates, open rates, engagement rates |
| In-App Messages | Targeted messages, recommendations, guidance | User actions, conversion rates |
| Chatbots | Automated service, answering questions | Resolution rate, escalation rate, satisfaction |
| Email Marketing | Campaigns, newsletters, promotions | Click-through rates, conversion rates, unsubscribe rate |
| Social Media Messaging | Customer support, brand awareness | Response rates, resolution rates, satisfaction |
Key Messaging Metrics
To improve your messaging strategy, track these key metrics:
Engagement Metrics
- Open Rates: The percentage of recipients who opened your messages.
- Click-Through Rates (CTR): The percentage who clicked links or calls-to-action in messages.
- Response Rates: The percentage who replied to messages.
Conversion Metrics
| Metric | Description |
|---|---|
| Conversion Rates | The percentage who completed a desired action, like making a purchase or filling out a form. |
| Lead Generation | The number of new leads generated from messaging campaigns. |
| Revenue Attribution | The revenue generated from messaging campaigns. |
Retention Metrics
| Metric | Description |
|---|---|
| Unsubscribe Rates | The percentage who opted out of receiving messages. |
| Churn Rates | The percentage who stopped engaging with your brand. |
| Customer Lifetime Value (CLV) | The total value of a customer over their relationship with your brand. |
Sentiment Analysis
- Sentiment Scores: A measure of the emotional tone (positive, negative, or neutral) in responses.
- Emotion Detection: The ability to identify specific emotions like happiness or frustration in responses.
- Topic Analysis: The identification of common topics or themes in responses.
Engagement Metrics
Engagement metrics show how users interact with your messaging campaigns. These metrics help you understand if your messaging strategy works well and where you can improve.
Open Rates
Open rates measure the percentage of recipients who opened your messages. A high open rate means your subject lines, sender names, or other factors grabbed users’ attention — or that a lot of your list uses Apple Mail. To get more opens:
- Write catchy subject lines
- Use recognizable sender names
- Send messages at the best times
| Metric | Description |
|---|---|
| Open Rate | Percentage of recipients who opened your messages |
| Formula | (Number of opens ÷ Number of delivered messages) × 100 |
Click-Through Rates
Click-through rates (CTR) measure the percentage of users who clicked links or calls-to-action in your messages. A high CTR means your message content is relevant and engaging. To improve CTR:
- Create relevant, personalized content
- Use clear, prominent calls-to-action
- Optimize your message layout
| Metric | Description |
|---|---|
| CTR | Percentage of users who clicked links or calls-to-action |
| Formula | (Number of clicks ÷ Number of delivered messages) × 100 |
Note that some tools report click-to-open rate instead, dividing clicks by opens rather than by deliveries. The two produce very different numbers. Check which one your tool means before comparing anything.
Response Rates
Response rates measure the percentage of users who replied to your messages. A high response rate means your message content encourages users to interact with your brand. To get more responses:
- Create personalized, relevant content
- Use clear, concise language
- Optimize when you send messages
| Metric | Description |
|---|---|
| Response Rate | Percentage of users who replied to your messages |
| Formula | (Number of responses ÷ Number of delivered messages) × 100 |
Conversion Metrics
Conversion metrics show how well your messaging campaigns drive desired actions or results. These metrics help you understand if your messaging strategy is working to achieve its goals.
Conversion Rates
Conversion rates measure the percentage of users who took a desired action after seeing your message. This could be making a purchase, filling out a form, or signing up for a newsletter. Tracking conversion rates is key to evaluating the success of your messaging campaigns.
| Metric | Description |
|---|---|
| Conversion Rate | Percentage of users who took a desired action |
| Formula | (Number of conversions ÷ Number of delivered messages) × 100 |
Use delivered rather than sent as the denominator, and use it consistently across every rate in your report. Mixing the two is how the same campaign ends up with two different conversion rates in two different slides.
To improve conversion rates:
- Create personalized, relevant content for your target audience
- Use clear calls-to-action in your messages
- Ensure your messaging channels align with your conversion goals
Lead Generation
Lead generation metrics track the number of potential customers who showed interest in your product or service. This is important for evaluating how well your messaging campaigns drive leads. A lead could be someone who filled out a form, downloaded an asset, or requested a demo.
To capture more leads through messaging:
- Create targeted, personalized content addressing your audience’s needs
- Use prominent calls-to-action
- Align your messaging channels with your lead generation goals
Revenue Attribution
Revenue attribution metrics measure the revenue generated from your messaging campaigns. This is critical for understanding the return on investment (ROI) of your messaging efforts. To track revenue attribution, define what counts as a conversion (like making a purchase) and attribute the revenue to the messaging campaign that drove the conversion.
Be honest about the attribution window. A 30-day window credits your email for a purchase the customer was going to make anyway; a same-session window credits almost nothing. Pick one, write it down next to the number, and do not change it between reports.
Retention Metrics
Retention metrics show how well your messaging campaigns keep customers engaged over time. These metrics are key to understanding the long-term success of your messaging strategy.
Unsubscribe Rates
Unsubscribe rates track the percentage of users who opt-out of receiving your messages. A high unsubscribe rate may mean your content isn’t resonating or you’re sending too many messages. To reduce unsubscribe rates:
- Segment your audience: Send targeted, relevant content to the right people.
- Personalize messages: Use the customer’s name, tailor content to their interests, and make it engaging.
- Make unsubscribing easy: Provide a clear, easy-to-use unsubscribe link.
Making unsubscribe hard is not a growth tactic. It converts an unsubscribe into a spam complaint, and complaint rate is what mailbox providers use to decide whether your mail reaches anyone at all.
| Metric | Description |
|---|---|
| Unsubscribe Rate | Percentage of users who opted out of receiving messages |
| Formula | (Number of unsubscribes ÷ Number of delivered messages) × 100 |
Churn Rates
Churn rates measure the percentage of customers who stop using your product or service. A high churn rate may indicate your messaging campaigns aren’t effectively retaining customers. To reduce churn rates:
- Communicate product updates: Keep customers informed about new features, updates, and improvements.
- Personalize messages: Use data-driven insights to create targeted, relevant content.
- Show value: Highlight the benefits and value your product or service provides.
| Metric | Description |
|---|---|
| Churn Rate | Percentage of customers who stopped using your product or service |
| Formula | (Number of churned customers ÷ Total customers) × 100 |
Customer Lifetime Value
Customer Lifetime Value (CLV) measures the total revenue a customer generates over their lifetime. A high CLV indicates your messaging campaigns are effectively retaining customers and driving revenue. To improve CLV:
- Create targeted, personalized content: Use data-driven insights to create content that resonates with your audience.
- Show value: Highlight the benefits and value your product or service provides.
- Communicate product updates: Keep customers informed about new features, updates, and improvements.
| Metric | Description |
|---|---|
| Customer Lifetime Value | Total revenue generated by a customer over their lifetime |
| Formula | (Average order value × Purchase frequency) × Customer lifespan |
That formula gives you lifetime revenue, not lifetime value. Multiply by gross margin and subtract acquisition cost if you want a number you can make decisions with.
Sentiment Analysis
Sentiment analysis helps you understand how customers feel about your brand, products, or services by analyzing their messages. It provides insights into customer emotions and can help improve satisfaction.
Sentiment Scores
Sentiment scores measure the overall emotion expressed in a message, ranging from negative to positive. These scores let you quickly gauge customer feelings and prioritize responses.
- Negative scores: Show frustration, anger, or dissatisfaction. These messages may need immediate attention to address concerns and prevent potential churn.
- Positive scores: Suggest satisfaction, happiness, or positive experiences. These present opportunities to reinforce positive sentiment and strengthen customer relationships.
- Neutral scores: Indicate neutral or factual messages without strong emotions. These may require further analysis to understand the context and intent.
Sentiment scoring gets sarcasm, negation and domain jargon wrong often enough to matter. Use it to triage a queue, not to report a number to the board. Spot-check a sample against human reading before you trust the trend line.
Emotion Detection
Emotion detection identifies specific emotions expressed in messages, such as anger, joy, sadness, or surprise. This deeper analysis provides insights into the root causes of customer emotions, helping you tailor your responses accordingly.
For example, if a customer expresses anger, you can prioritize their message and respond with empathy and a solution-oriented approach. If a customer expresses joy, you can reinforce that positive sentiment and strengthen the relationship.
Accuracy claims for emotion detection deserve more scepticism than sentiment scoring, not less. It is a harder problem with fewer agreed-on labels.
Topic Analysis
Topic analysis identifies the main themes or subjects discussed in customer messages. This helps you understand the most common topics, concerns, or questions raised by your customers, allowing you to optimize your messaging content and strategies.
By analyzing topics, you can:
| Benefit | Description |
|---|---|
| Identify common topics | Uncover frequently discussed products, features, or services, and provide relevant information or updates. |
| Uncover pain points | Identify common pain points or areas for improvement based on recurring customer concerns or complaints. |
| Tailor content | Adjust your messaging content to address the most relevant topics for your audience. |
| Monitor trends | Keep track of emerging trends or topics that may require attention or action. |
Of the three techniques here, topic analysis is the one most likely to earn its keep. Counting what people ask about is a lower bar than guessing how they feel about it.
Messaging Analytics Tools
Businesses use messaging analytics tools to measure the success of their messaging campaigns. Pricing for all three tools below was checked in August 2026 and should be confirmed with the vendor before budgeting.

Correction. An earlier version of this article said Google Analytics could monitor message delivery rates and open rates. It cannot. Google Analytics measures what happens on your website or app. It has no visibility into whether a message was delivered or opened — that data lives in your email service provider, SMS gateway or push platform, and nowhere else.
What Google Analytics 4 does do for messaging is pick up the traffic after the click, provided you tag your links properly:
- Sessions and users arriving from a tagged campaign link
- What those visitors did on site
- Conversions and revenue attributed to the campaign
- Audience and behaviour reporting to help segment
The free tier is genuinely free, with real limits: data retention capped at 14 months, sampling in explorations above high query volumes, a daily cap on BigQuery export, and a 50,000-value ceiling on high-cardinality dimensions before the rest collapses into “(other)”. The paid tier is Google Analytics 360. Google does not publish a rate for it; it is sold through sales teams and resellers, priced on event volume with an annual contract. Reported figures vary widely and none of them come from Google, so no number is quoted here. Get a quote against your own volumes.
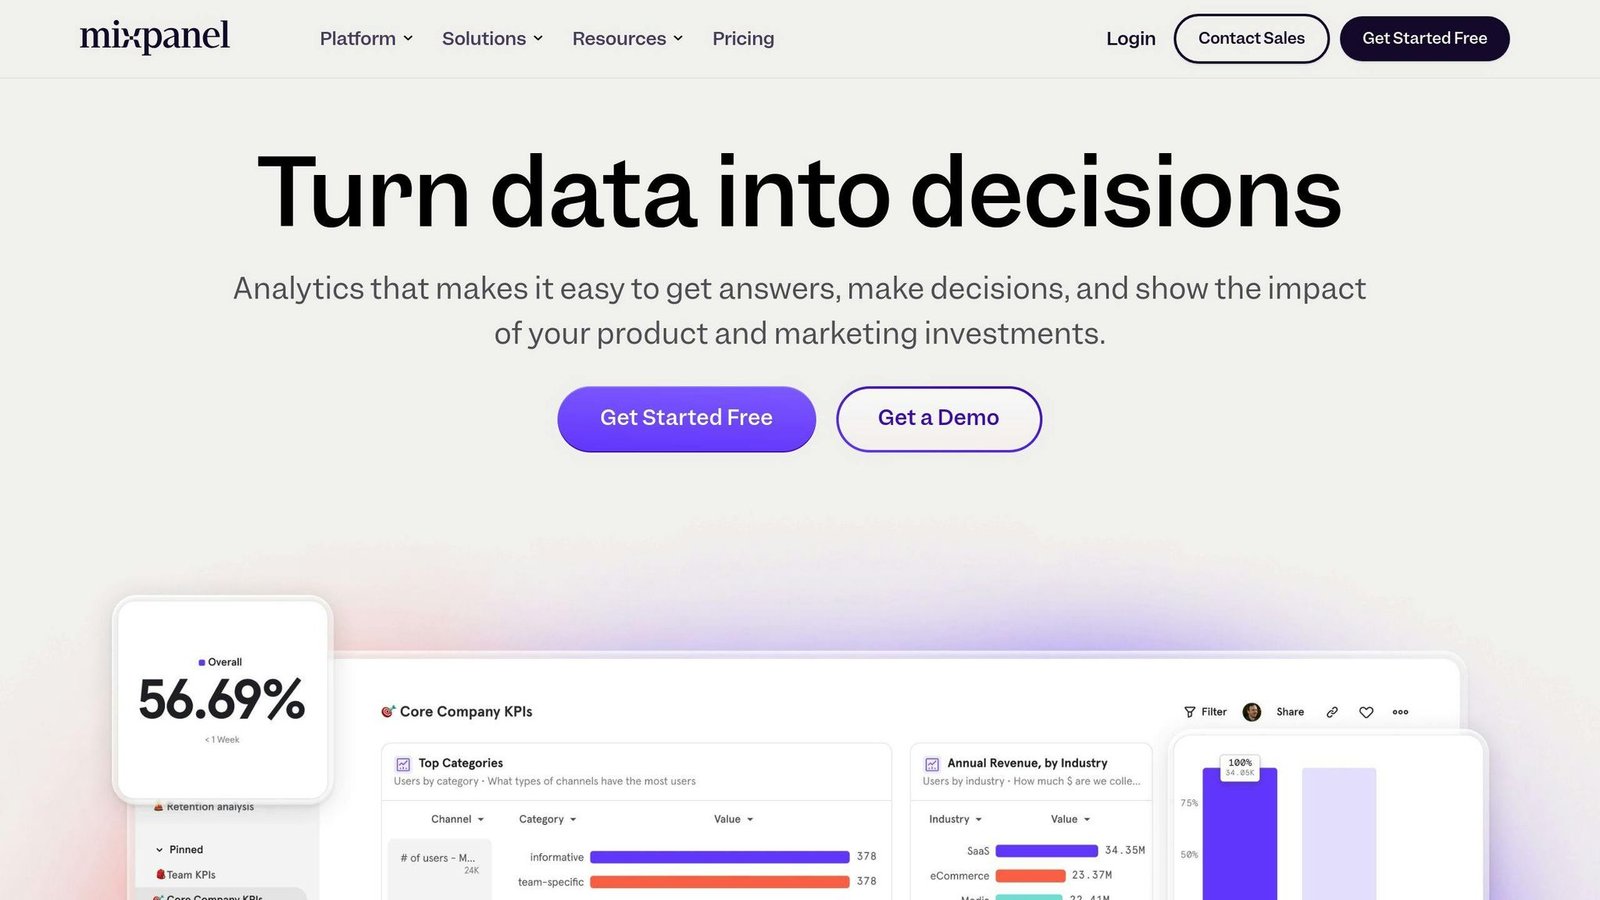
Mixpanel is a product analytics tool that tracks user behavior and retention. For messaging analytics, Mixpanel can monitor what users do after they arrive:
- Clicks and in-product events
- Conversions
- Funnels, retention analysis and A/B testing
Correction. An earlier version said Mixpanel’s pricing is based on the number of tracked users. It is not. Mixpanel meters on monthly events. The free plan allows up to 1 million events a month with unlimited seats. The Growth plan scales with event volume above that. Enterprise is quote-only. Because the meter is events rather than people, a chatty implementation that fires an event on every scroll can cost more than a large user base does — instrument deliberately.
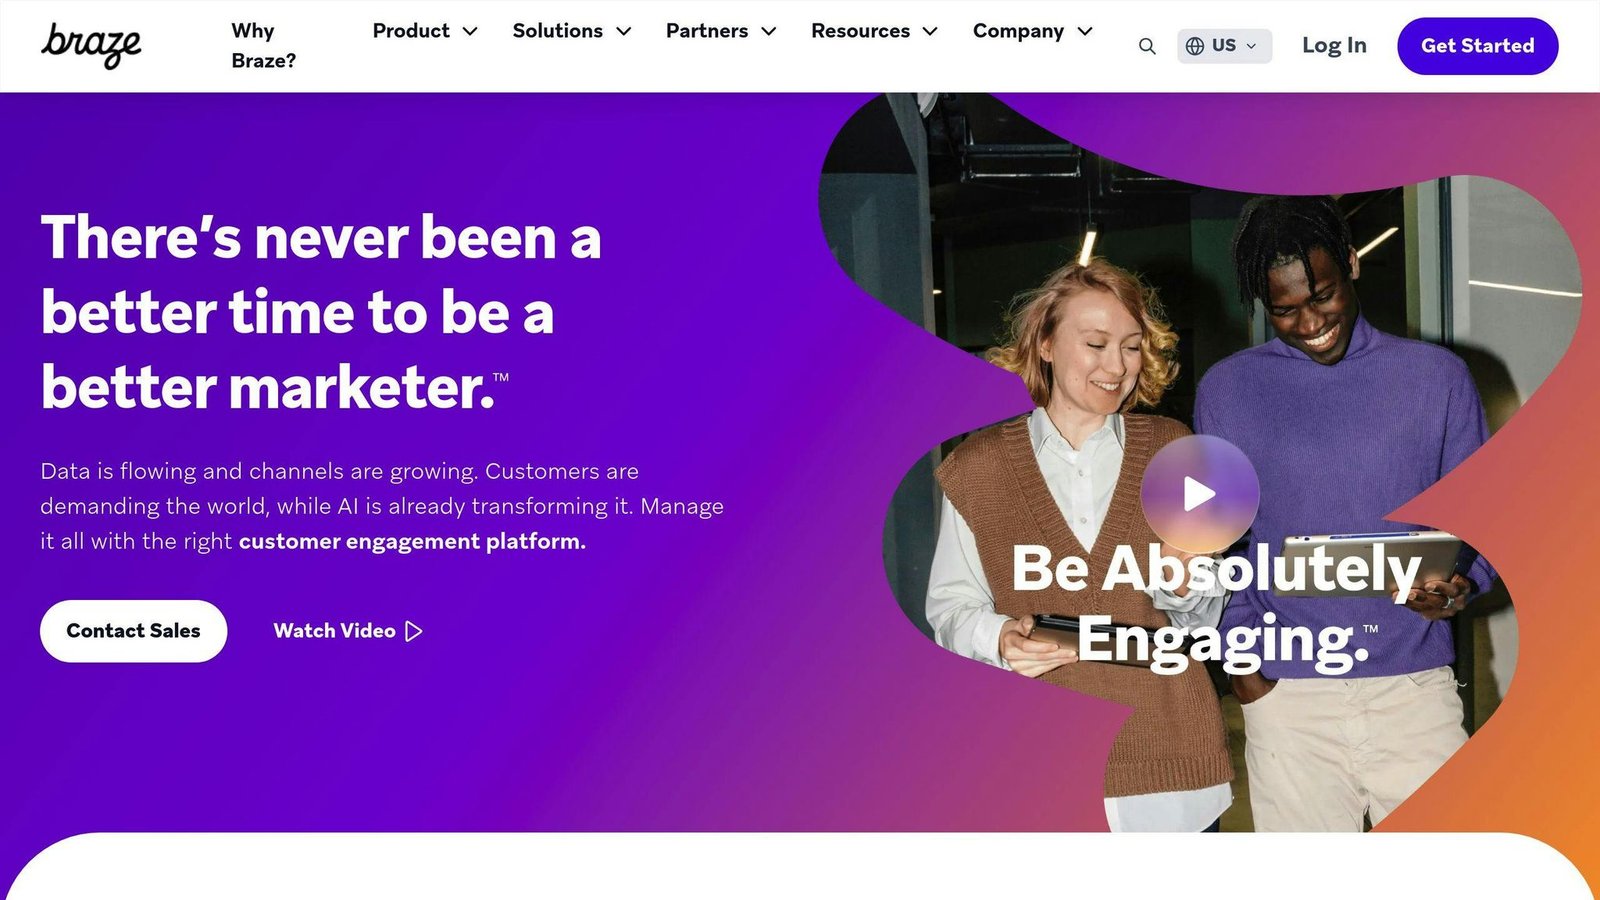
Braze is a customer engagement platform. Unlike the two above, it sends the messages as well as measuring them, so it does have delivery and open data. With Braze, businesses can track:
- Message delivery
- Opens
- Clicks
- Conversions
Braze also offers customer segmentation, personalization, and A/B testing. It publishes no pricing at all — every deal is quoted, and it is positioned at the enterprise end of the market. If you are a small business comparing it against a free Mixpanel plan, you are not comparing like with like.
| Tool | What it measures for messaging | Pricing |
|---|---|---|
| Google Analytics 4 | Post-click behaviour on your site or app, conversions, revenue attribution. Not delivery or opens. | Free tier with retention, sampling and cardinality limits. GA 360 is quote-only, metered on event volume, annual contract. No published rate. |
| Mixpanel | In-product events, funnels, retention, A/B tests. | Metered on monthly events. Free up to 1M events/month with unlimited seats; Growth scales above that; Enterprise quote-only. |
| Braze | Delivery, opens, clicks, conversions, plus segmentation and personalization. It is also the sending platform. | No published pricing. Quote-only, enterprise-oriented. |
For most small businesses the honest answer is that your existing email or SMS platform already reports delivery, opens, clicks and unsubscribes, and adding a product analytics tool only helps if you need to see what happens after the click. Buy the second tool when you have a question the first one cannot answer.
Best Practices
Data Collection
To get useful insights, set up your messaging analytics tool correctly. Track key metrics like:
- Delivery rates
- Click-through rates
- Response rates
- Conversion rates
Collect data from all messaging channels:
- SMS
- Push notifications
- In-app messages
- Chatbots
- Email marketing
- Social media messaging
Segmentation
Divide your audience into groups based on:
- Demographics
- Behavior
- Preferences
- Engagement levels
This lets you tailor messaging strategies to specific audience segments, making them more relevant and effective.
Reporting
Create clear reports from your messaging data. Use:
| Reporting Element | Purpose |
|---|---|
| Tables | Organize data |
| Charts | Visualize trends and patterns |
| Graphs | Identify areas for improvement |
Write the denominator on every rate you publish. Half the arguments about messaging performance are two people using the same word for different sums.
Regular Review
Regularly review your messaging analytics to ensure your strategies are working well. Analyze your data to:
- Identify areas for improvement
- Adjust messaging campaigns as needed
This ongoing process helps you optimize your messaging channels and improve customer engagement and conversion.
Summary
What Messaging Analytics Is Good For
Messaging analytics tells you which sends earned attention and which did not. By tracking click-through rates, response rates, conversion rates and unsubscribes, you learn what your audience actually responds to.
It also tells you what to stop doing, which is usually the more valuable half.
Best Practices for Messaging Analytics
Data Collection
- Track key metrics across all messaging channels (SMS, push notifications, in-app messages, chatbots, email marketing, social media messaging).
- Collect data on delivery rates, click-through rates, response rates, and conversion rates.
Segmentation
- Divide your audience into groups based on demographics, behavior, preferences, and engagement levels.
- Tailor messaging strategies to specific audience segments for increased relevance and effectiveness.
Reporting
- Create clear reports using tables, charts, and graphs to organize and visualize data.
- Focus on key metrics that align with your business goals.
- State the denominator on every rate.
Regular Review
- Regularly review your messaging analytics to identify areas for improvement.
- Adjust messaging campaigns as needed.
- Re-check the caveats: open rates stay inflated, and SMS still has none.
What to Take Away
Track fewer metrics and define them properly. A short report where every number means what it says beats a dashboard of forty tiles nobody trusts. Decide on clicks, replies and conversions; treat opens as weak evidence; and never compare your numbers to a published benchmark whose method you cannot see.
More on this topic
Browse all 44 articles on Marketing & Growth, or jump straight to our buying guide: Best Marketing and CRM Tools for Small Businesses.