Analyzing historical sales data is critical for better decision-making in business. It helps identify trends, improve forecasting, and optimize strategies. This article highlights the top 7 tools for analyzing sales data, focusing on their features, pricing, and suitability for businesses in the United States.
Key Takeaways:
- Salesforce Sales Cloud: AI-powered insights, customizable dashboards, starts at $25/user/month.
- Oracle Sales Analytics: Large-scale data processing, forecasting tools, starts at $100/user/month.
- Microsoft Power BI: Interactive visualizations, affordable at $10/user/month.
- Tableau: Advanced trend analysis, priced at $70/user/month for Creator licenses.
- Zoho Analytics: Budget-friendly for small teams, starts at $22/month for two users.
- HubSpot Sales Analytics: User-friendly pipeline tools, starts at $45/month for two users.
- BizBot: Free directory for finding and managing sales analytics tools.
These tools cater to different business sizes and needs, from small startups to large enterprises. Choosing the right tool depends on your budget, data volume, and integration requirements.
How to Automate Data Analysis from Sales Reports with AI
How We Selected These Tools
To help businesses make smart choices for analyzing historical sales data, we carefully assessed each tool based on several key factors. These criteria were designed to ensure the tools could handle the unique challenges faced by US businesses managing complex sales data.
First, we focused on data visualization capabilities. Turning raw numbers into clear, actionable visuals is critical. Tools limited to basic bar charts didn't make the list. Instead, we prioritized platforms that support advanced features like trend analysis and group comparisons, along with customizable dashboards. The ability to zoom into specific time periods or customer segments was a must.
We also looked at how well each tool integrates with popular US accounting software like QuickBooks and Xero. Since many businesses follow US GAAP standards, compatibility with these systems is crucial. The tools also needed to align with US-specific reporting periods, including tax years and fiscal quarters.
Reporting features were another area of focus. We tested how well each tool could generate reports tailored to different audiences, from executives to team leads. Tools that stood out offered scheduled reporting, customizable branding, and export options compatible with Microsoft Office and Google Workspace.
Scalability was equally important. Whether a business processes thousands of transactions or millions, the tool had to perform consistently. Platforms that struggled with larger datasets or required expensive upgrades were excluded.
Ease of use was a major consideration. A tool’s power means little if it’s too complicated for teams to use. We favored platforms with intuitive interfaces, comprehensive documentation, and support available during US business hours to ensure smooth adoption.
Pricing transparency was non-negotiable. Tools with hidden fees, overly complex pricing tiers, or extra charges for basic features like exporting data were eliminated. We focused on tools with straightforward, predictable pricing that adjusts reasonably as businesses grow.
Lastly, security and compliance were critical. Only tools with strong security measures and compliance with regulations like SOX for publicly traded companies were included. Tools that lacked proper audit trails didn’t make the cut.
Each tool on our list meets these stringent criteria, excelling in areas that cater to businesses of all sizes across the US.
7 Best Tools for Historical Sales Data Analysis
The following tools have been selected for their ability to efficiently analyze historical sales data while meeting the needs of U.S. businesses.
Salesforce Sales Cloud
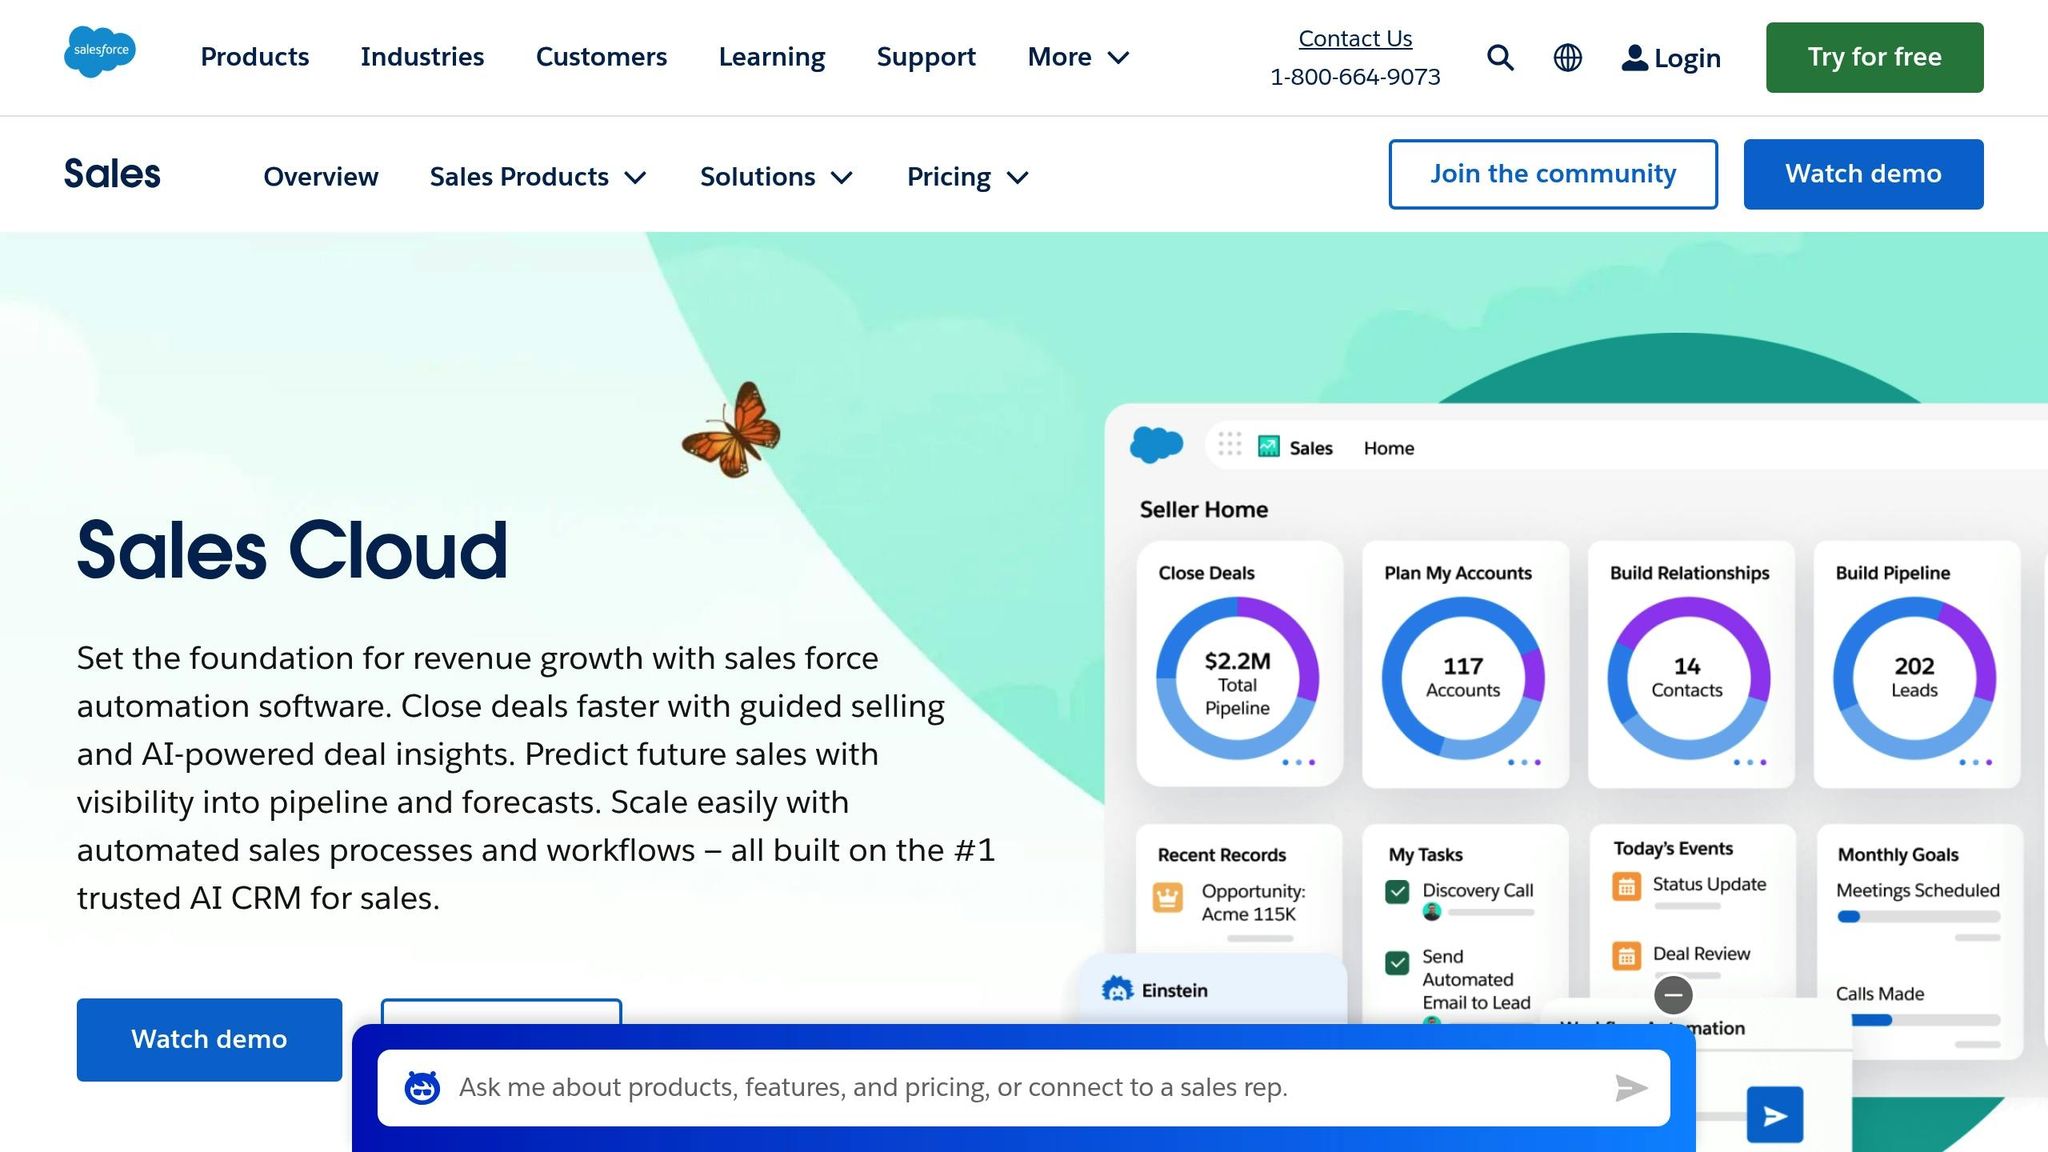
Salesforce Sales Cloud offers detailed tracking of historical sales data. It records every customer interaction, deal progression, and revenue milestone, creating a timeline that spans years of business activity. With its Einstein Analytics feature, the platform uses AI to uncover patterns in historical data that might otherwise go unnoticed.
The system's customizable dashboards allow users to analyze sales trends across different timeframes - from daily metrics to multi-year comparisons. Sales managers can dive into specific quarters to study seasonal trends or evaluate individual team member performance over time.
Salesforce integrates seamlessly with popular U.S. accounting platforms like QuickBooks Enterprise and NetSuite, ensuring consistent data across financial systems. Its Reports and Dashboards feature generates automated reports that adhere to U.S. GAAP standards, simplifying the reconciliation of sales data with accounting records.
Pricing starts at $25 per user per month for the Essentials plan. The Professional plan, at $75 per user per month, includes advanced reporting features, while the Enterprise plan, starting at $150 per user per month, offers access to Einstein Analytics and greater customization.
Oracle Sales Analytics
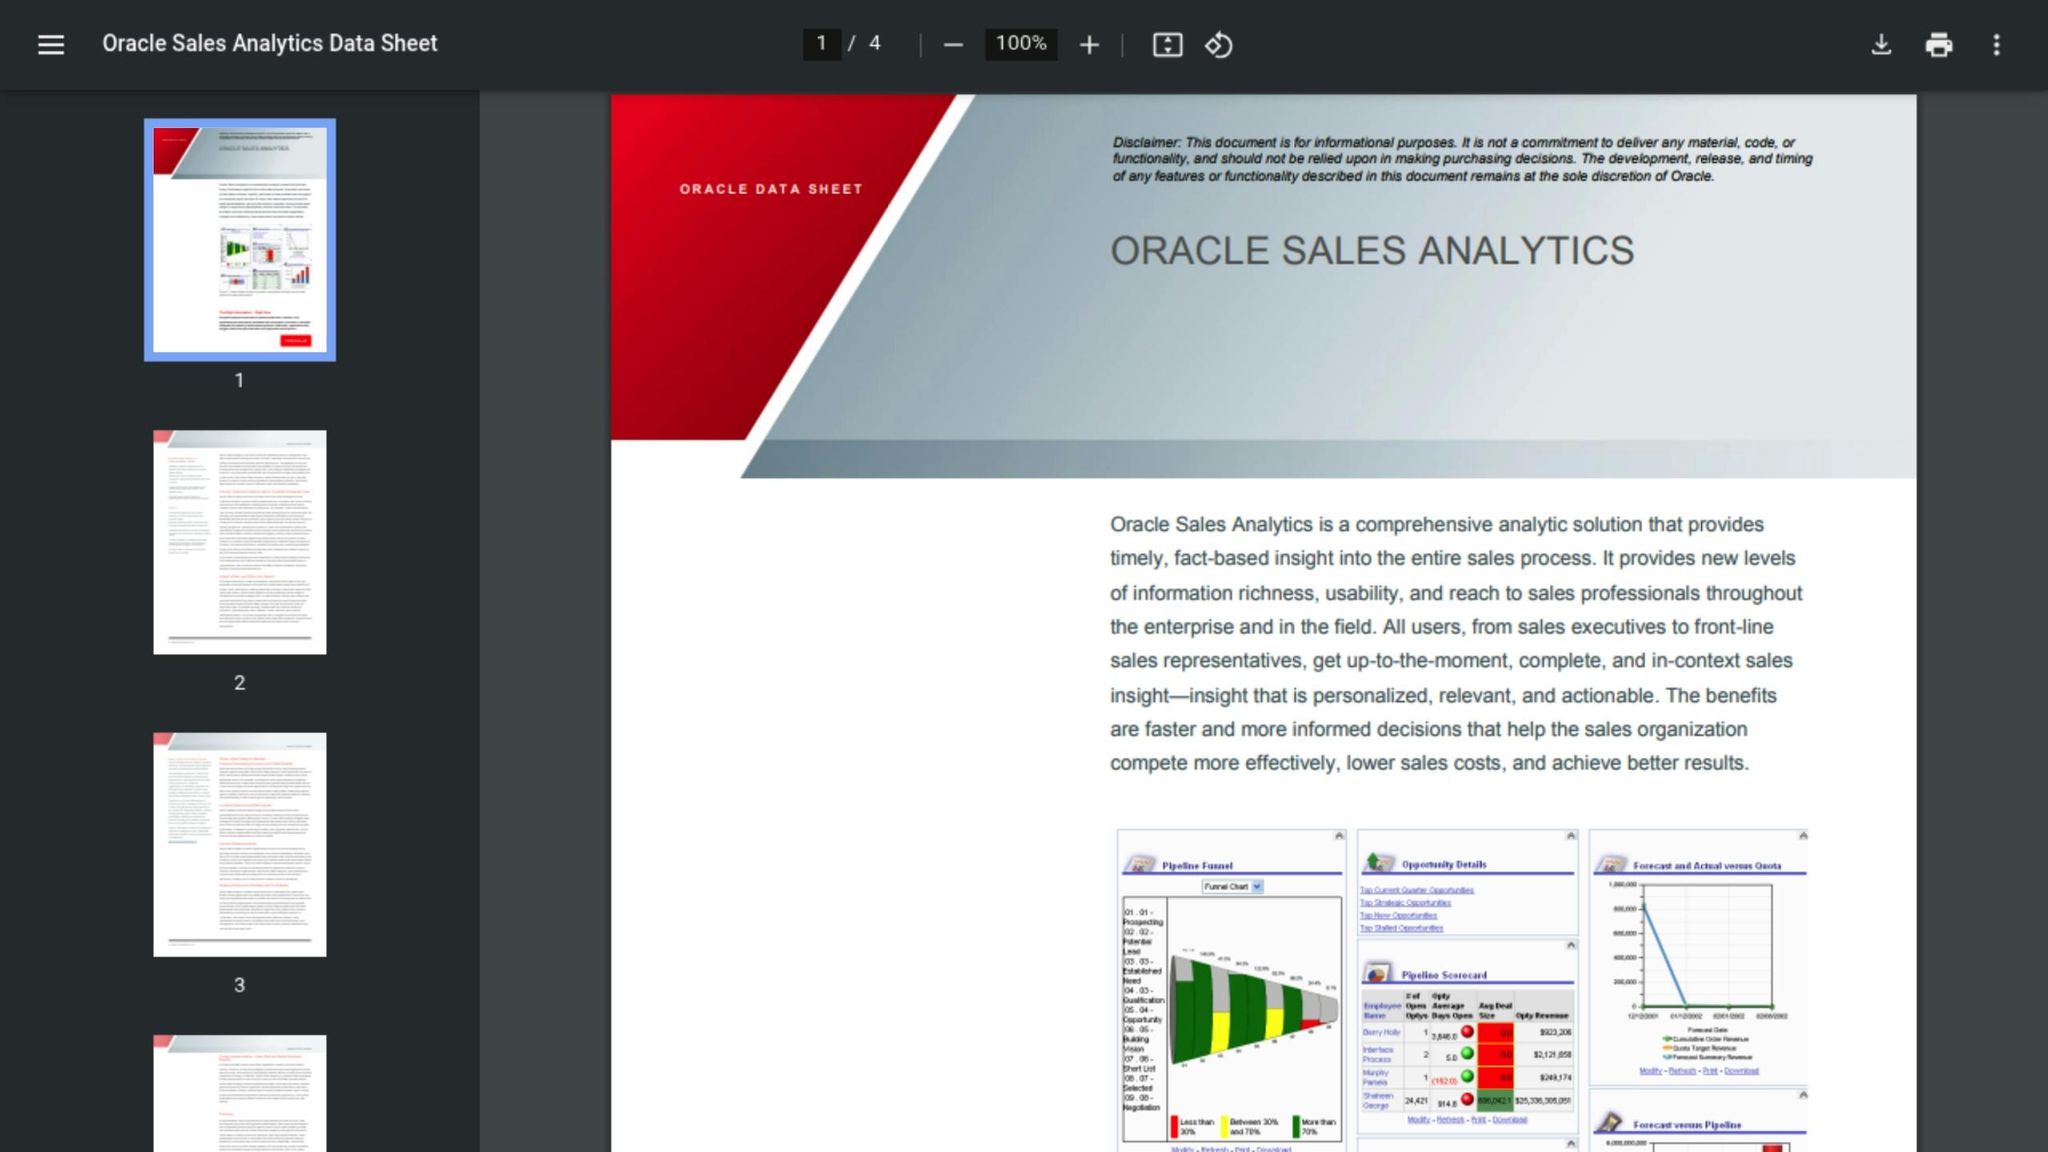
Oracle Sales Analytics stands out for processing large volumes of historical data with speed and precision. Its pre-built KPI dashboards and forecasting engine analyze past performance to predict future sales trends and compare current results against previous periods.
The platform’s pipeline analysis tools help sales teams identify bottlenecks by comparing current deal progression against historical benchmarks. Oracle integrates with its broader suite of business applications, providing a unified view of customer data across sales, marketing, and service functions.
Pricing ranges from $100 to $300 per user per month, depending on the modules and features required, following Oracle's enterprise pricing model.
Microsoft Power BI
Microsoft Power BI transforms raw sales data into interactive visualizations. Its drag-and-drop interface lets users create detailed reports without needing technical skills. Sales teams can build dashboards to compare year-over-year performance, track seasonal trends, and identify top-performing products or regions.
The platform’s data modeling tools combine multiple sources, such as CRM systems, financial records, and external market data, to give a comprehensive view of historical sales alongside drivers like marketing spend or competitor activity.
Power BI’s time intelligence functions simplify comparisons, such as "this month vs. last month" or "Q3 2024 vs. Q3 2023", without requiring complex formulas. Integration with Microsoft tools like Excel, SharePoint, and Teams ensures smooth connectivity. Pricing begins at $10 per user per month for Power BI Pro, with Premium features available for $20 per user per month.
Tableau
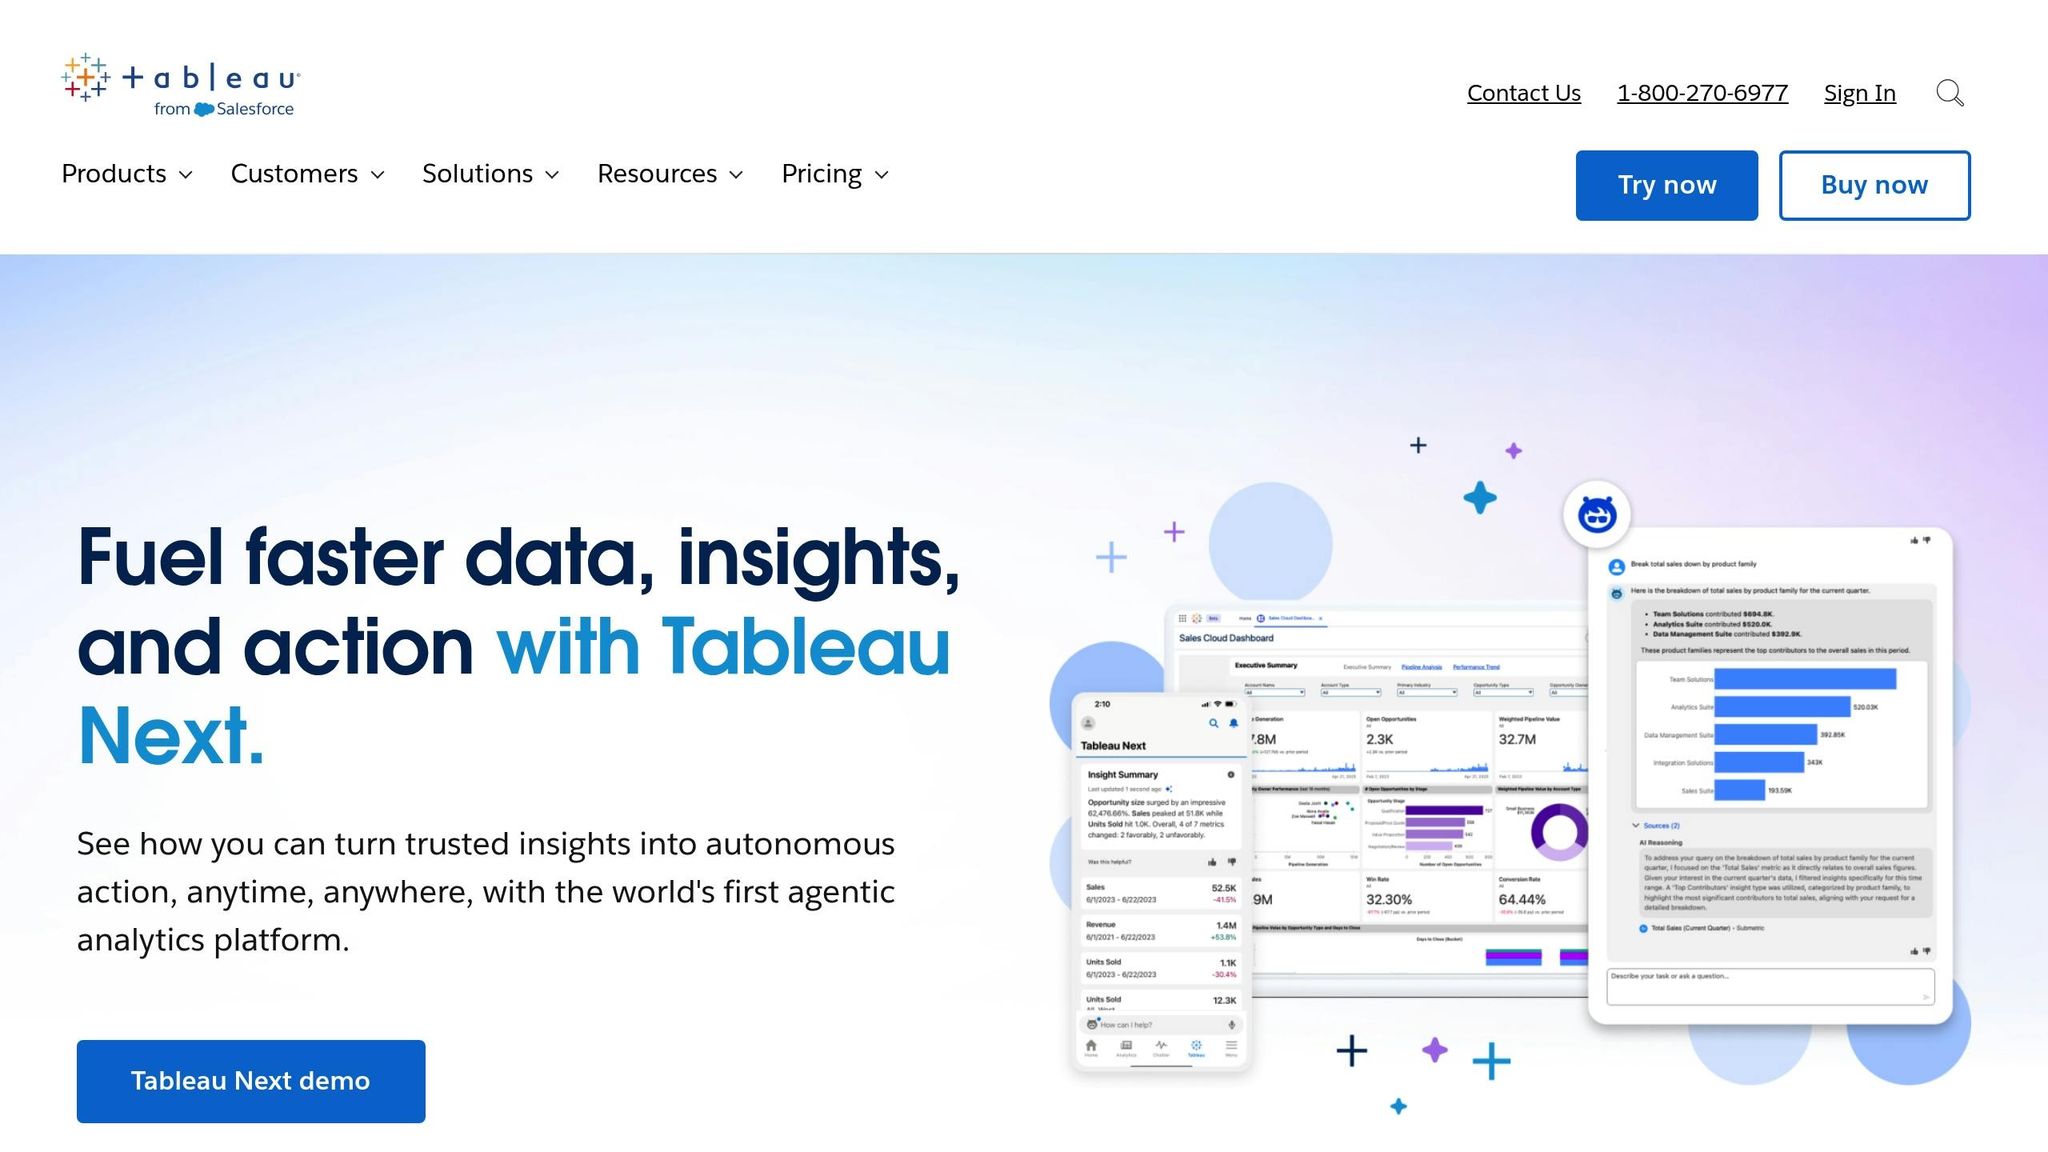
Tableau excels at turning historical sales data into clear visuals. Its interactive dashboards allow users to explore data by clicking, filtering, and drilling into specific time periods or customer segments. This makes it easier to spot trends that might be overlooked in spreadsheets.
The platform’s trend analysis features highlight key changes in sales performance, while users can overlay metrics like revenue, lead generation, and conversion rates to better understand sales drivers. Tableau’s storytelling capabilities help sales leaders present insights to stakeholders through guided narratives that combine charts, maps, and annotations.
Tableau connects with nearly any data source, from cloud-based CRMs to on-premise databases, and its real-time refresh feature ensures dashboards remain up to date. Tableau Creator licenses cost $70 per user per month, while Explorer licenses are $35 per user per month.
Zoho Analytics
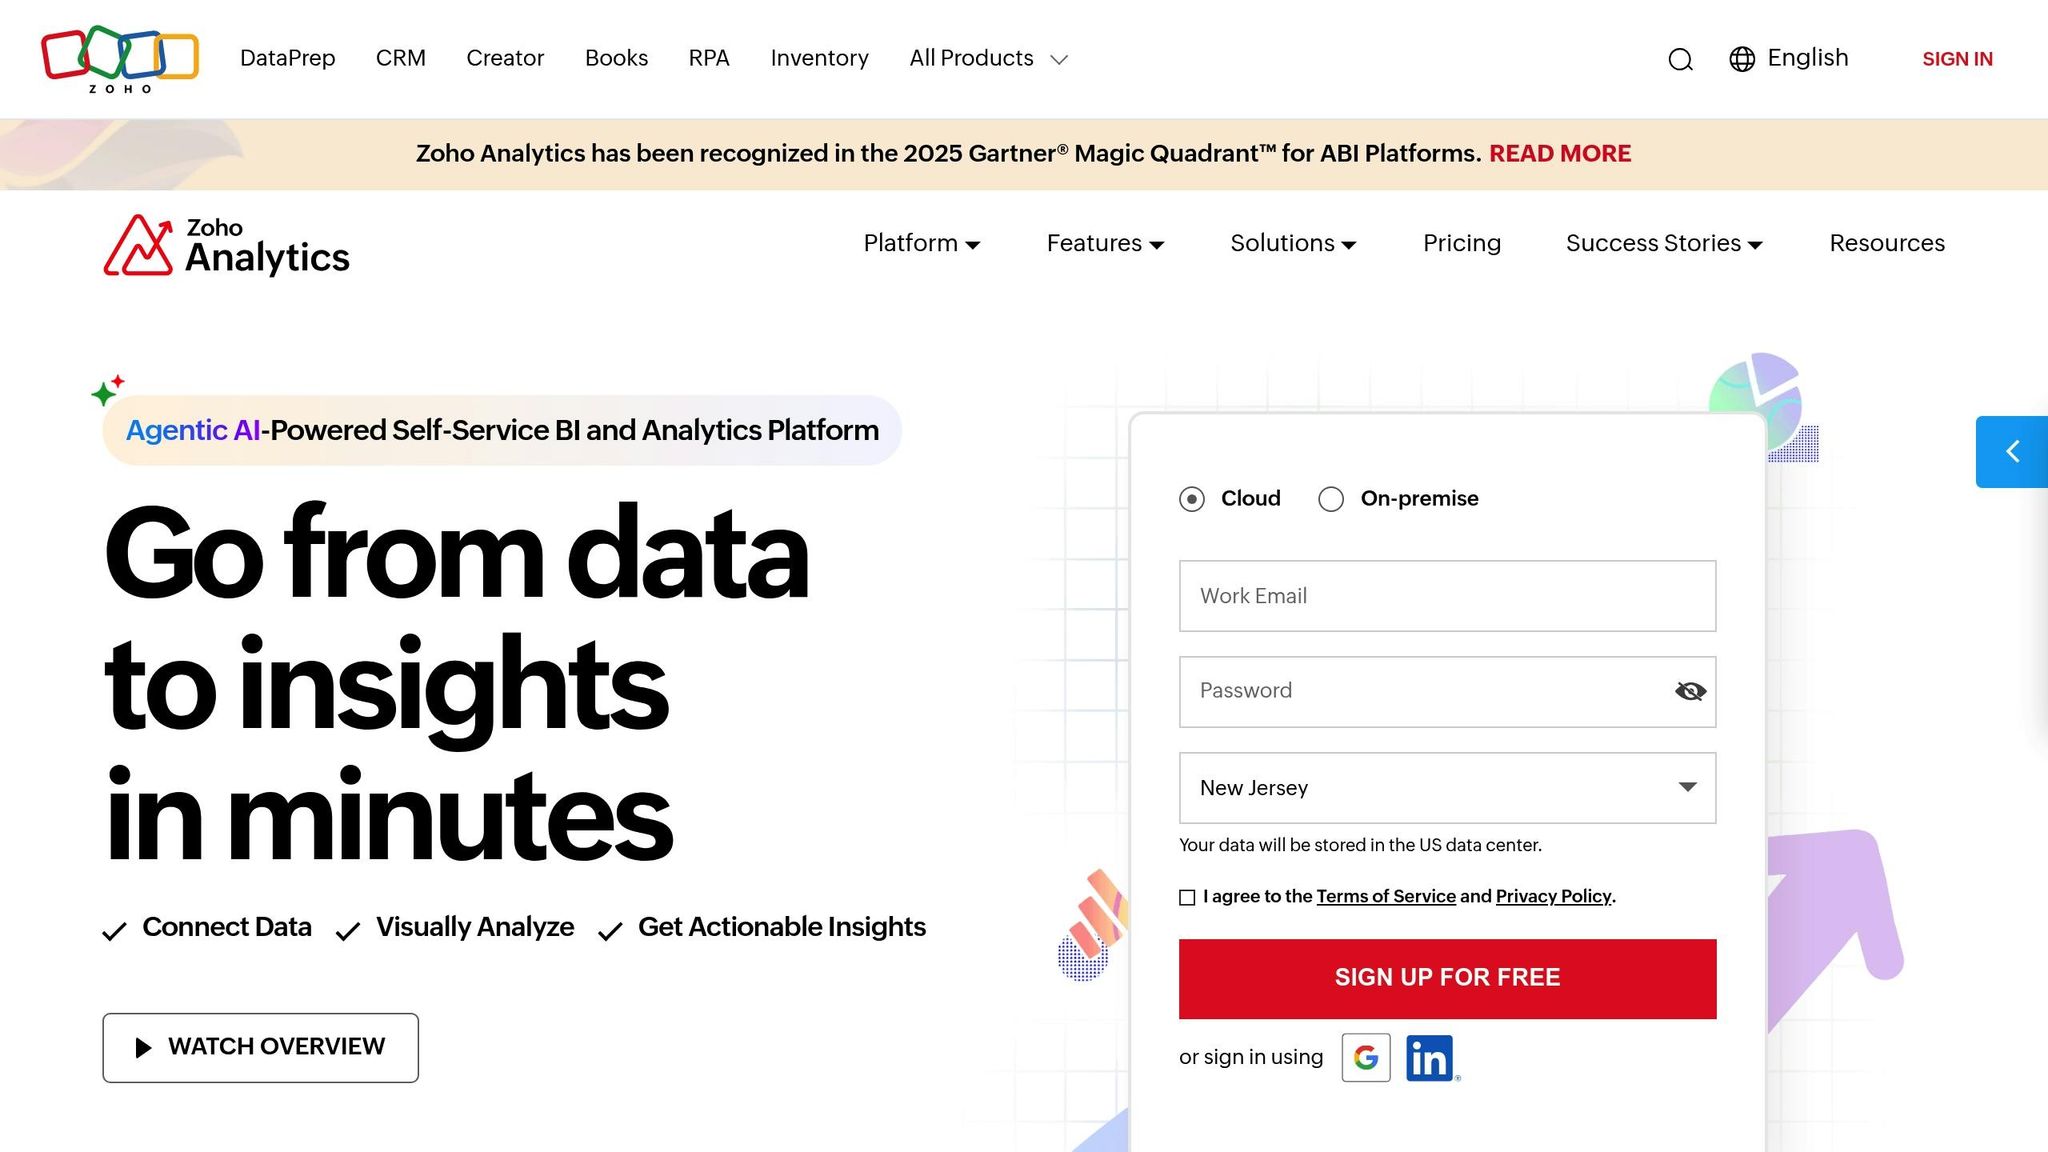
Zoho Analytics is a practical option for small to medium-sized U.S. businesses. Its automated data import connects with popular sales and accounting tools, keeping historical data current without manual updates.
The platform’s customizable report builder generates professional sales reports, covering metrics like quarterly revenue, year-over-year growth, and seasonal performance. Zoho’s performance tracking tools also help teams analyze how representatives, territories, or products have performed historically, identifying top contributors and successful strategies.
Collaboration features allow team members to share insights and annotate reports with observations. Integration with other Zoho applications creates a unified business management system. Pricing starts at $22 per month for two users, with the Standard plan at $45 per month for up to five users, offering advanced analytics.
HubSpot Sales Analytics
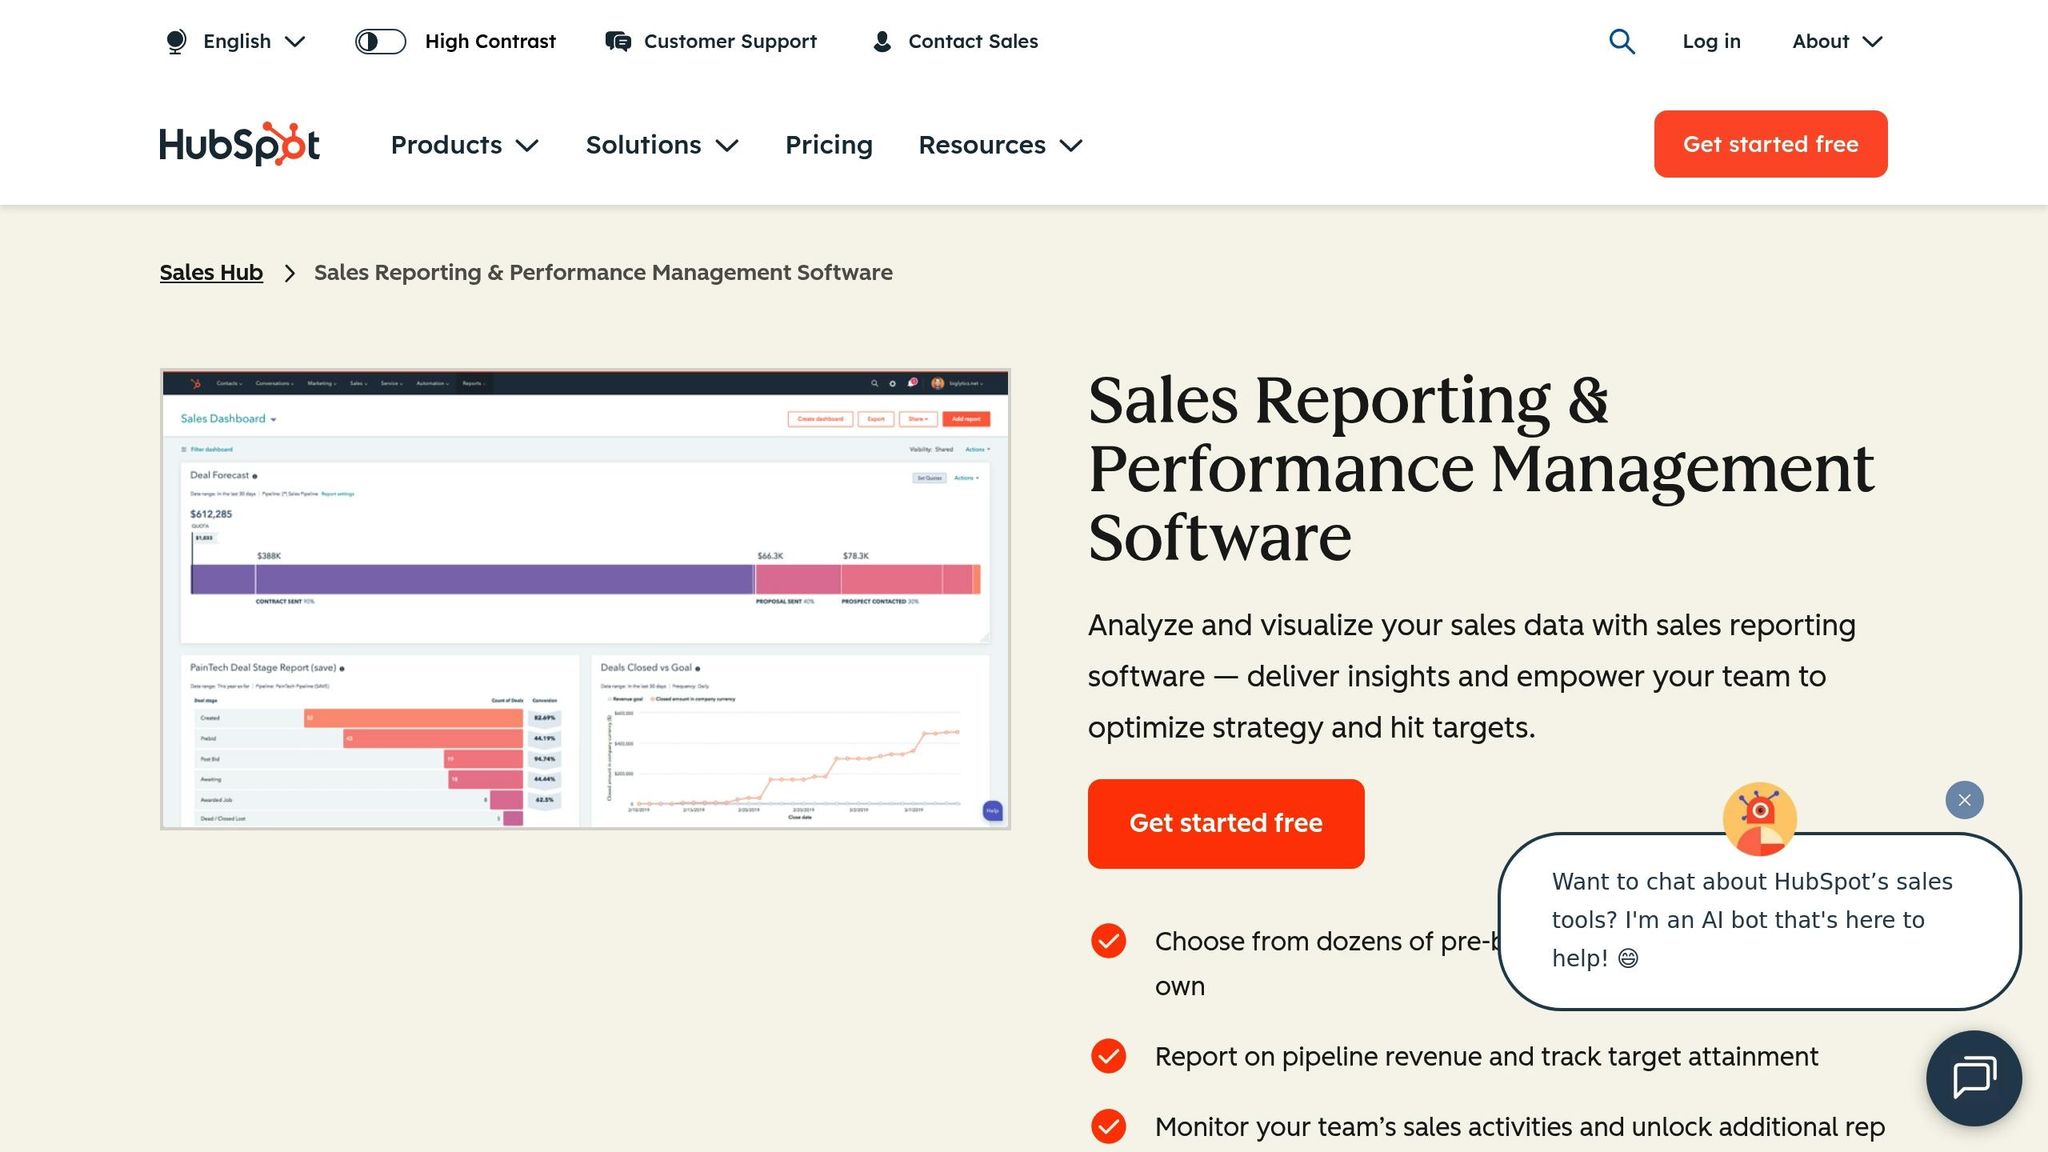
HubSpot’s sales analytics platform provides a user-friendly interface for analyzing historical data. Its pipeline visualization tools show how deal progression has changed over time, helping managers identify shifts in conversion rates or sales cycles.
The platform’s attribution reporting tracks which marketing efforts and sales activities contributed to closed deals, offering insights into customer behavior and strategy effectiveness. With segment analysis, users can compare performance across customer types, deal sizes, or regions, highlighting growth or decline in specific areas.
Automated reporting delivers scheduled updates to stakeholders, complete with customizable branding. HubSpot’s Sales Hub starts at $45 per month for two users, with Professional features available at $450 per month for up to five users.
BizBot
BizBot acts as a directory for sales analytics tools, helping U.S. businesses find and evaluate solutions for historical sales data analysis. It categorizes tools by functionality, making it easier for companies to build integrated technology stacks.
BizBot also includes subscription management features, helping businesses optimize spending on analytics tools and related services. This makes it a valuable resource for small businesses and growing companies looking to enhance their sales analysis capabilities.
Tool Comparison: Features and Pricing
When it comes to picking the right tool for analyzing historical sales data, the choice depends on how well each platform fits your business needs. Below is a breakdown of key features, pricing, and other important factors to help guide your decision:
| Tool | Key Features | Pricing | US Localization | Suitable Business Size | Main Benefits |
|---|---|---|---|---|---|
| Salesforce Sales Cloud | AI-powered analytics (Einstein), customizable dashboards, flexible integrations | Varies by plan | US business reporting standards | Small to Enterprise | Advanced analytics and seamless integrations |
| Oracle Sales Analytics | Robust dashboards, forecasting tools, enterprise-level integrations | Enterprise-grade pricing | US business reporting standards | Mid-market to Enterprise | Handles large data volumes efficiently, offers forecasting insights |
| Microsoft Power BI | Drag-and-drop interface, time intelligence functions, Excel/Teams integration | Affordable | Integrates with US-oriented systems | Small to Large | Budget-friendly with a familiar interface |
| Tableau | Interactive dashboards, trend analysis, real-time data refresh | Competitively priced | US-standard formatting | Mid-market to Enterprise | Exceptional visualization capabilities and extensive connectivity |
| Zoho Analytics | Automated data import, customizable reports, collaboration tools | Competitive for small teams | Tailored for US reporting | Small to Medium | Easy to set up, cost-effective for smaller teams |
| HubSpot Sales Analytics | Pipeline visualization, segment reporting, automated insights | Varies by features | Aligned with US marketing standards | Small to Medium | User-friendly interface with strong marketing integrations |
| BizBot | Tool directory, subscription management, curated categories | Free directory access | Focused on US business environment | Small to Growing | Simplifies tool discovery and optimizes subscription costs |
The table gives a snapshot of each platform, but let’s dive deeper into how these features and pricing compare.
Price Considerations
Pricing plays a big role in decision-making. For budget-conscious businesses, Microsoft Power BI offers an affordable solution without compromising on functionality. On the other hand, Oracle Sales Analytics comes with enterprise-level pricing, reflecting its robust capabilities. For smaller teams, Zoho Analytics delivers strong value with its competitive pricing.
Feature Depth
Each tool brings something unique to the table. Salesforce Sales Cloud stands out with its Einstein-powered AI analytics, while Tableau excels in visual storytelling and trend analysis. Oracle Sales Analytics is designed for processing massive datasets efficiently, and Power BI integrates smoothly with Microsoft's ecosystem, making it a natural fit for businesses already using Excel or Teams.
US Localization
All of these tools adhere to US reporting standards, ensuring compatibility with local business practices. Power BI and Tableau also support US-standard formats, making setup and reporting straightforward.
Business Size Alignment
The size and stage of your business often dictate the best fit. Smaller businesses may find Zoho Analytics or HubSpot Sales Analytics sufficient for their needs, while mid-sized companies might lean toward Tableau or Power BI for their advanced features. Larger enterprises typically require the scalability and integrations offered by Salesforce or Oracle.
BizBot's Role
While not a direct competitor to these platforms, BizBot plays a supporting role by simplifying tool selection and subscription management. It helps businesses optimize costs and streamline the discovery of specialized tools, complementing rather than replacing these platforms.
Total Cost of Ownership
It's important to look beyond just subscription fees. The overall cost includes implementation, training, and maintenance. For instance, Power BI offers a quicker setup process compared to the more complex implementation of Oracle Sales Analytics. Factoring in these additional costs can help you make a well-rounded decision.
Each tool has its strengths, and the right choice depends on your specific business needs, budget, and long-term goals.
sbb-itb-d1a6c90
Real-World Applications and Best Practices
Analyzing historical sales data has reshaped how businesses approach their sales strategies. Building on the earlier tool comparisons, let’s explore how different platforms have been used to improve performance. Companies across industries have successfully revamped their sales processes by using these tools wisely, offering lessons for any organization aiming to boost results.
Sales Performance Tracking in Action
The best results come from starting with clear goals and measurable KPIs. For example, in 2023, businesses that embraced advanced sales analytics reported a 20% increase in revenue by aligning their analytics efforts with specific, trackable objectives. These goals often included targets like growing average deal size by 15%, raising lead-to-customer conversion rates to 25%, or maintaining a 95% customer retention rate.
Salesforce Sales Cloud users often rely on Einstein AI to uncover patterns in historical data that might be overlooked by human analysis. Its customizable dashboards provide real-time performance tracking, allowing sales managers to adjust strategies well before quarterly reviews.
For companies already embedded in the Microsoft ecosystem, Microsoft Power BI is a standout option. Its time intelligence tools make it easy to analyze seasonal sales trends and year-over-year performance without requiring complex setup. The drag-and-drop interface empowers sales managers to create custom reports without waiting for IT support.
Trend Analysis and Revenue Forecasting
When it comes to identifying long-term sales trends, Tableau leads the way with its interactive dashboards. Teams use its visual tools to spot emerging opportunities or declining product lines early, helping them act before profits take a hit. Its real-time data refresh ensures that forecasts are always based on the most current information.
For enterprise-level needs, Oracle Sales Analytics is a powerhouse. It efficiently handles massive datasets, making it ideal for large-scale trend analysis. Businesses use its forecasting tools to predict revenue months ahead, enabling smarter resource allocation and more strategic planning. These insights are especially impactful when seamlessly integrated with existing systems.
Integration Best Practices
Smooth integration is essential when choosing analytics tools. Focus on platforms that can connect effortlessly with your existing CRM and sales systems. This ensures unified data from multiple sources, automates workflows, and embeds analytics into your team’s day-to-day operations.
For example, implementing a centralized sales tracking system through your chosen platform can streamline customer data, automate repetitive tasks, provide real-time pipeline visibility, and improve collaboration. HubSpot Sales Analytics excels at this, offering pipeline visualization tools and automated insights that connect seamlessly with marketing efforts.
For smaller teams needing a quick setup, Zoho Analytics is a practical choice. Its automated data import features reduce the manual work usually required to maintain historical sales records.
Strategic Implementation Approaches
Start small. Test the platform with a single team or product line before rolling it out company-wide. This phased approach allows for process refinement and user training without overwhelming your organization.
BizBot can assist during this phase by helping businesses find complementary tools to enhance their main analytics platform. Its curated directory simplifies the search for specialized solutions, while its subscription management features help control costs across multiple tools.
Once the platform is in place, focus on user adoption. Even the most advanced analytics tools won’t deliver results if your team doesn’t use them consistently. Offer thorough training and ensure the tool integrates seamlessly into daily workflows to avoid adding extra administrative tasks.
Data Quality and Maintenance
The effectiveness of historical sales data analysis depends entirely on the quality of the data being used. Establish clear standards for data entry and schedule regular cleanup processes. Many companies assign specific team members to oversee data accuracy and completeness.
Periodic audits of your historical data can uncover gaps or inconsistencies that might distort your analysis. While most platforms include data validation tools, human oversight remains crucial for maintaining data integrity over time.
These examples highlight how strategic implementation of analytics tools can transform sales operations. Success doesn’t just come from picking the right platform - it’s about setting clear objectives, ensuring smooth integration, and committing to maintaining high data quality. Businesses that follow these practices often see measurable gains in both sales performance and revenue growth.
How to Choose the Right Tool for Your Business
Picking the best historical sales data analysis tool can make all the difference when turning spreadsheets into meaningful insights. With more U.S. businesses leaning on data-driven strategies, finding the right tool isn’t just a technical choice - it’s a key decision for growth.
Start by considering your company’s size and complexity. For smaller businesses, tools like HubSpot Sales Analytics or Zoho Analytics often work well. They’re straightforward and cater to smaller-scale needs. Mid-sized companies, on the other hand, might find Microsoft Power BI a better fit, especially with its seamless Office 365 integration. For larger enterprises managing massive datasets, platforms like Salesforce Sales Cloud or Oracle Sales Analytics offer the robust features and scalability needed to handle intricate sales operations. While these enterprise solutions require a higher investment, they’re designed to support complex workflows and long-term growth.
Budget is more than just the subscription fee. Factor in additional costs like implementation, staff training, and system integrations when calculating the total cost of ownership.
Integration is key. The tool you choose should easily connect with your existing CRM, accounting software, and other business systems. Poor integration can lead to fragmented data, making it harder to get a clear picture of your sales performance.
Match the tool’s complexity to your team’s technical skills. A resource like BizBot can help you find tools that balance advanced features with ease of use. This ensures your team can actually leverage the tool’s capabilities without feeling overwhelmed.
Scalability matters. A tool that works for a small team today might not hold up as your business grows. Look for platforms that can expand alongside your operations to avoid the hassle of switching tools down the line.
Once you’ve narrowed down your options based on size, budget, and integration needs, take the time to test the tool. Most reputable platforms offer free trials or demos - use these to upload your actual historical data and assess performance. Pay attention to things like how quickly reports generate, how responsive dashboards are, and whether the data analysis feels accurate and reliable.
Ultimately, the right tool should strike a balance between ease of use for your sales team and the analytical depth your leadership needs. When functionality, cost, and usability align, your sales data becomes a powerful asset for driving smarter business decisions.
FAQs
How can I choose the right sales data analysis tool for my business?
Choosing the best sales data analysis tool hinges on your business's size, needs, and objectives. For small businesses, it's smart to look for easy-to-use tools that can grow alongside your company. On the other hand, larger organizations often require robust platforms with advanced capabilities to handle intricate sales workflows.
When deciding, think about the amount of data you manage, how complex your sales operations are, and your plans for growth. Evaluating these factors will guide you toward a tool that matches both your present needs and long-term goals.
What should I consider when calculating the total cost of ownership for a sales data analysis tool?
When assessing the total cost of ownership (TCO) for a sales data analysis tool, you need to look beyond just the initial purchase price. There are several costs to consider, such as implementation fees, licensing, maintenance, and support. It's also important to include expenses for training and onboarding your team to ensure they can use the tool effectively.
Don't overlook future costs like software upgrades, adapting the tool as your business expands, and investments in security or disaster recovery. Think about how long you plan to use the tool and anticipate your company's growth to get a clearer picture of long-term expenses. A detailed evaluation will help you choose a tool that fits both your budget and your business needs in the long run.
Why is it important for a sales data analysis tool to integrate with your existing systems, and what problems can arise if it doesn’t?
Why Integration Matters for Sales Data Analysis Tools
When selecting a sales data analysis tool, how well it integrates with your existing systems is key. A strong integration ensures smooth data flow, accurate reporting, and timely insights - everything you need to make smart business decisions. With a properly integrated tool, you can skip the hassle of manual data entry, minimize errors, and get a clear, unified picture of your sales performance.
On the flip side, skipping integration can lead to some serious headaches. You might end up with isolated data silos, delayed reporting, or incomplete and inconsistent data. These issues can slow down your operations, cause you to miss opportunities, and lead to poor strategic choices - none of which are good for your bottom line. By prioritizing tools that integrate seamlessly, you'll ensure your systems work together to drive your business forward.


