Lucidchart is a browser-based diagramming tool for flowcharts, org charts, process maps and technical diagrams that several people can edit at once. It is the closest modern equivalent to Visio, but built for the web and for teams rather than a single desktop. It sits inside Lucid’s wider suite alongside a whiteboard product and a cloud-architecture visualiser, and it is often adopted first by one team and then spread across a company because everyone needs to draw something eventually.
What you can actually do with it
The basics are drag-and-drop shapes on an infinite canvas, but the parts that save real time are further in.
- Draw the standard business diagrams. Flowcharts, swimlane process maps, org charts, network and system architecture diagrams, entity-relationship diagrams and UML all have proper shape libraries rather than generic boxes.
- Edit together in real time. Multiple people can work on the same diagram simultaneously, with comments, @mentions and revision history so feedback lives on the diagram instead of in email.
- Generate diagrams from data. You can import a spreadsheet or CSV and have it build an org chart or process map, then use conditional formatting so shapes change colour based on the underlying values.
- Use AI and text to skip the drawing. Diagrams can be generated from a text prompt, and technical users can write markup or code to produce sequence diagrams and ERDs rather than placing shapes manually.
- Embed diagrams where people work. Integrations with Jira, Confluence, Slack, Microsoft Teams, Notion, Google Workspace and Salesforce let a live diagram sit inside the document or ticket that references it.
- Publish and export cleanly. Diagrams can be shared by link with view or edit permissions, embedded in websites, or exported to PDF, PNG and Visio formats.
Who it fits best
Lucidchart fits operations managers, product and project managers, business analysts and IT teams — anyone who needs to explain how something works to people who were not in the room. It is especially useful for documenting processes during onboarding, mapping approval chains, or sketching a system before building it.
For a small business, the usual trigger is realising that your processes only exist in one person’s head. A single person can get value from the free tier for occasional diagrams; teams of five to fifty who share and maintain documentation are where the paid plans start to make sense. Distributed teams benefit most, since the alternative is emailing image files around.
Things worth knowing before you commit
- The free tier is deliberately tight. It caps how many editable documents you can keep and how complex each one can be, so it works for trying the product but not for ongoing documentation.
- Paid plans are per user. Costs scale with the number of editors, though people who only need to view a diagram generally do not need a paid seat — confirm how your intended sharing pattern is licensed.
- The suite can complicate purchasing. Lucidchart, the whiteboard product and the cloud visualiser are separate things, and working out whether you need one or a bundle is part of the decision.
- Diagrams need maintenance. A process map that is eighteen months out of date is worse than none. Assign an owner for anything you intend to rely on.
- It can feel heavy for quick sketches. For a rough idea on a call, a whiteboard tool is faster. Lucidchart’s strengths show up when the diagram is meant to last.
Alternatives to compare it against
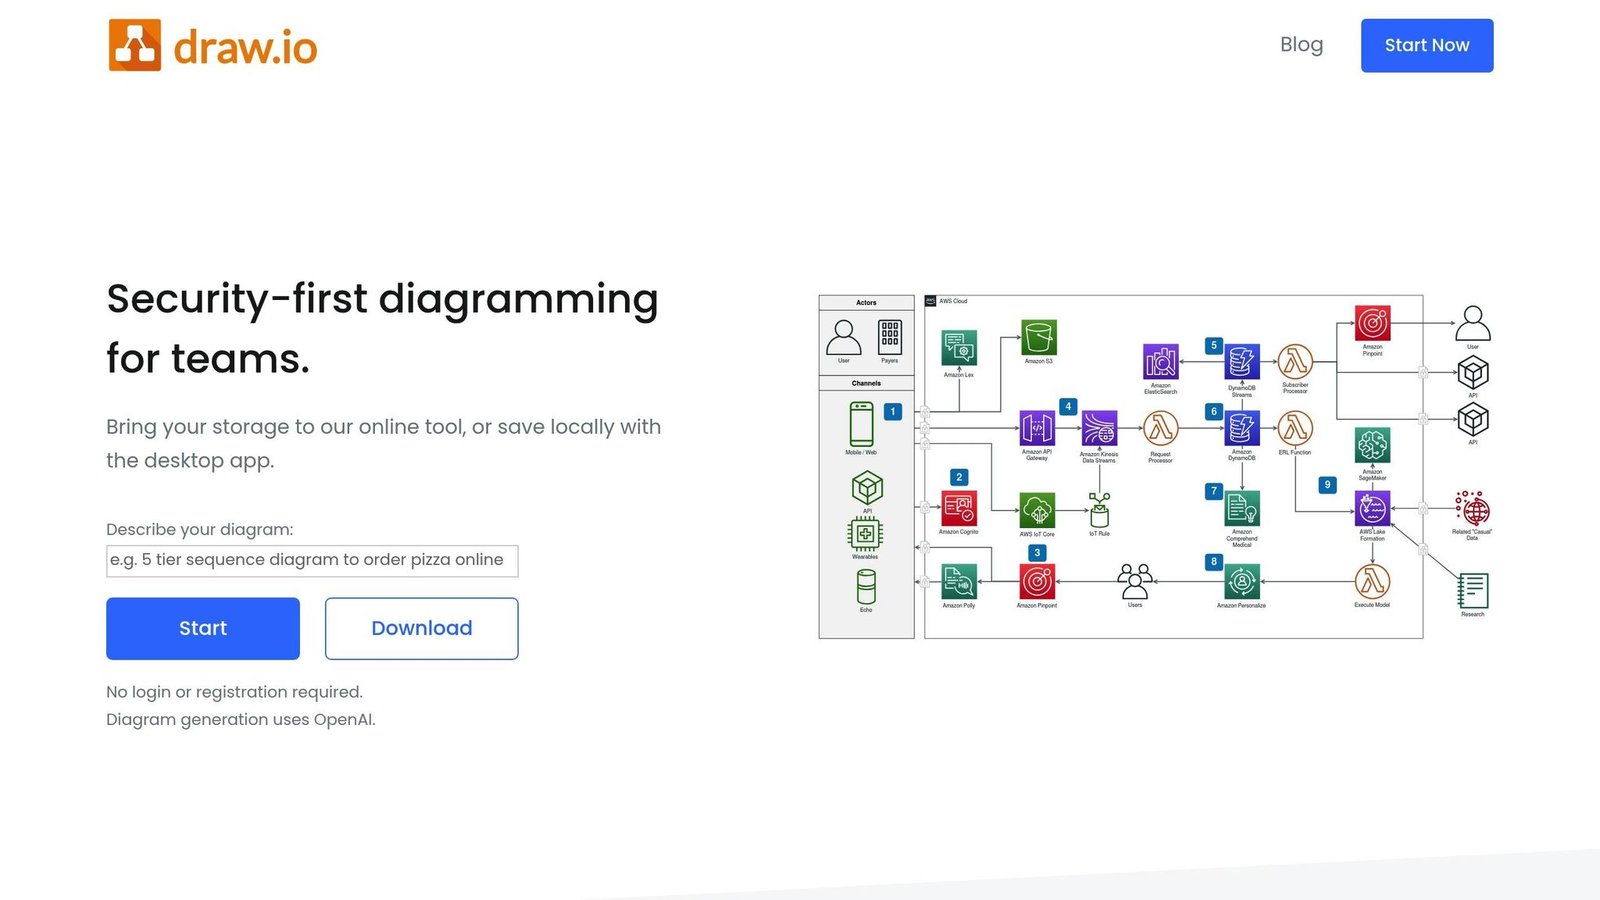
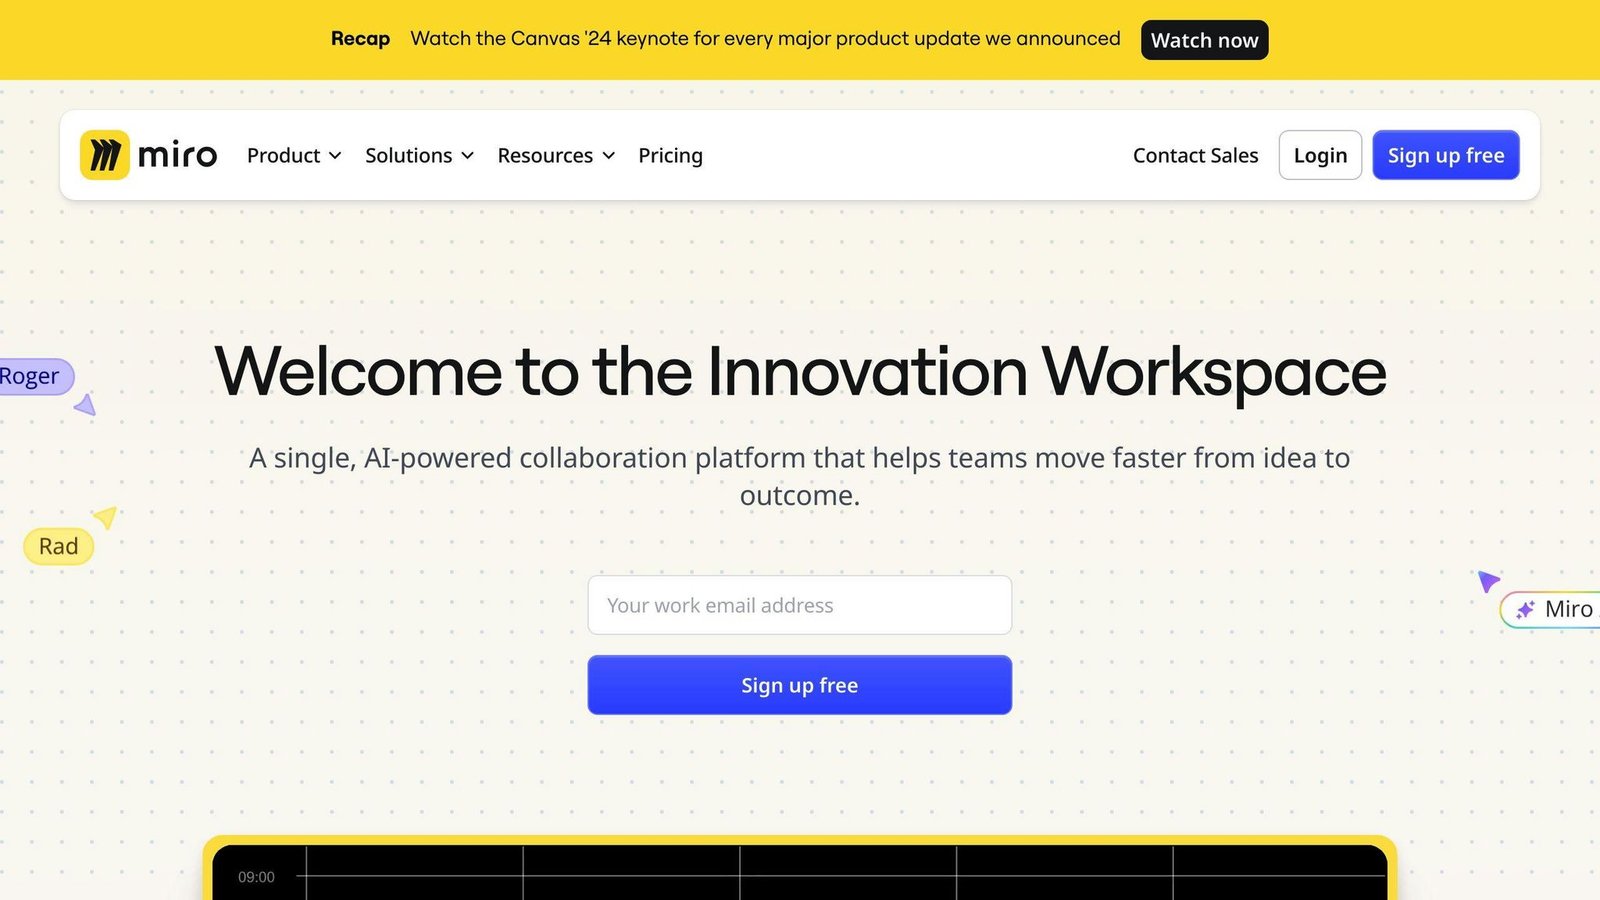
Miro and other whiteboard tools are better for messy, collaborative thinking and workshops, and worse for precise structured diagrams. Microsoft Visio remains the reference point in organisations already deep in Microsoft 365, particularly where existing Visio files matter. Draw.io, available free and self-hostable, covers most straightforward diagramming needs without a subscription if you can live with a plainer interface and fewer integrations. Figma and Canva can produce presentable diagrams if visual polish matters more than structure. And if the real goal is documenting workflows rather than drawing them, a process documentation tool may fit better than any diagram editor.
Plan tiers, free-tier limits and feature placement change regularly. Check Lucid’s own pricing page for current details before committing.
Further reading
- Complete Guide to Free Process Mapping Tools — covers the no-cost options worth testing before you pay for Lucidchart editor seats.
- Ultimate Guide to Knowledge Mapping — method for getting processes out of one person’s head and into a diagram worth maintaining.
- Ultimate Guide to Cloud Collaboration Tools — relevant to the real-time co-editing and commenting that distinguishes Lucidchart from desktop Visio.
- Top 8 Document Collaboration Tools for Teams — the Confluence, Notion and Google Workspace side of the stack that Lucidchart embeds into.
Have you used Lucidchart?
One sentence is enough. Would you pick it again, and why or why not? We publish the critical reviews too — that is the point.