Disclosure: This page contains commercial links. BizBot may earn a commission from qualifying purchases. Paid placements do not buy a better ranking. Read our affiliate disclosure.
AI tools for conversational insights analyse customer interactions – calls, chats, emails – at a scale manual review cannot reach. Instead of sampling, they read every conversation and surface trends, sentiment and recurring problems. Adoption figures previously quoted in this article could not be traced to a published source and have been removed.
Here’s a quick overview of the 7 tools covered:
- ThoughtSpot: Simplifies data exploration with natural language queries and real-time visualizations.
- Displayr: Offers text analytics and sentiment analysis with no coding required.
- Zendesk: Uses sentiment tagging and integrates with e-commerce platforms for better customer support.
- Power BI: Provides dynamic visualizations and advanced AI-driven insights.
- Yellow.ai: Tracks customer sentiment and integrates with multiple platforms for in-chat transactions.
- Avoma: Focuses on call analysis, providing emotional tone detection and actionable coaching insights.
- Tellius: Combines search analytics with anomaly detection and root cause analysis.
A note on evidence. Most vendors in this category publish customer results that cannot be independently checked – percentage gains, hours saved, satisfaction scores. Several such figures previously appeared in this article. We could not source any of them, so they have been removed rather than repeated. What is left is what the tools actually do.
Quick Comparison:
| Tool | Key Features | Best For |
|---|---|---|
| ThoughtSpot | Natural language querying, real-time visuals | Data exploration and reporting |
| Displayr | Text analytics, sentiment analysis | Market research |
| Zendesk | Sentiment tagging, e-commerce integration | Customer support |
| Power BI | Dynamic visualizations, AI insights | Business intelligence |
| Yellow.ai | Sentiment tracking, multi-platform integration | Customer engagement |
| Avoma | Call analysis, emotional tone detection | Sales and coaching |
| Tellius | Root cause analysis, anomaly detection | Advanced analytics |
These tools are ideal for businesses looking to analyze customer interactions and improve decision-making.
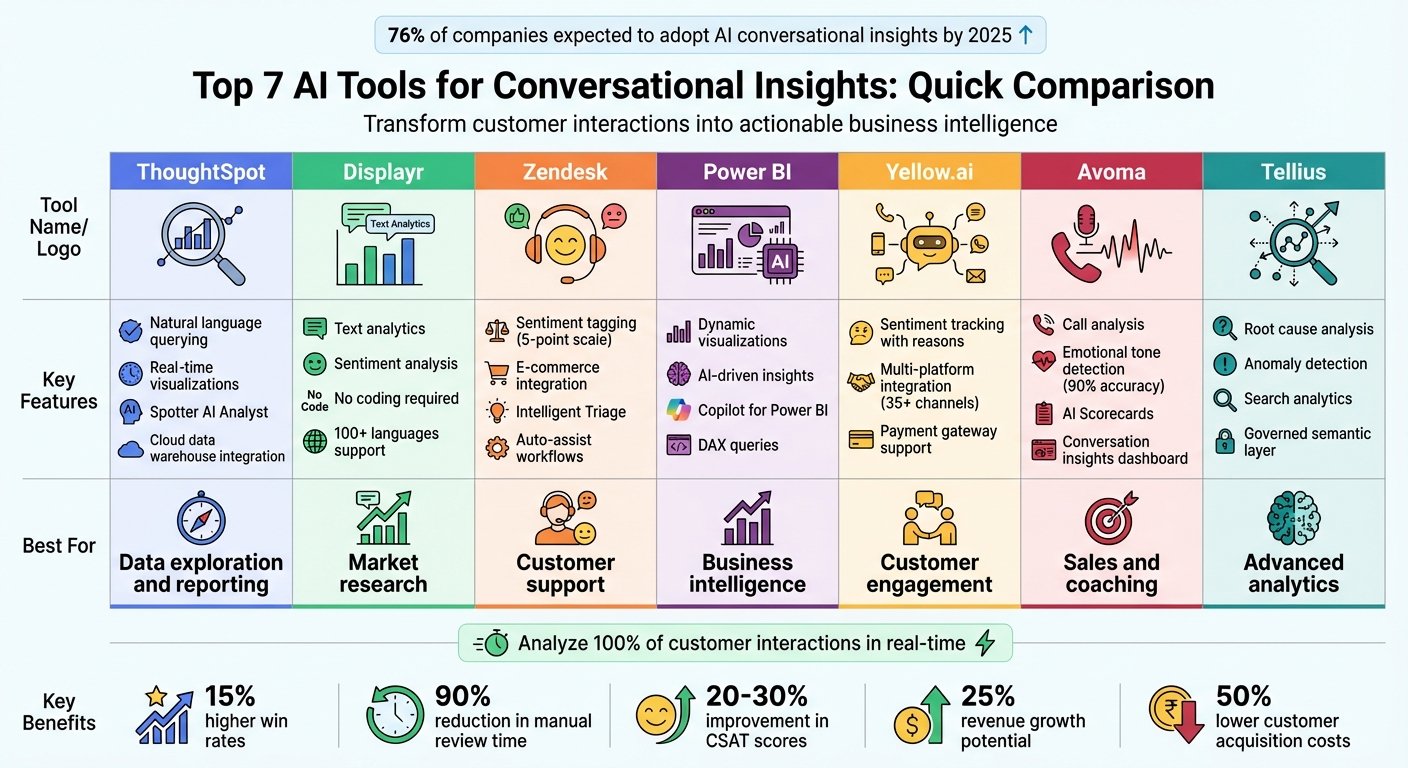
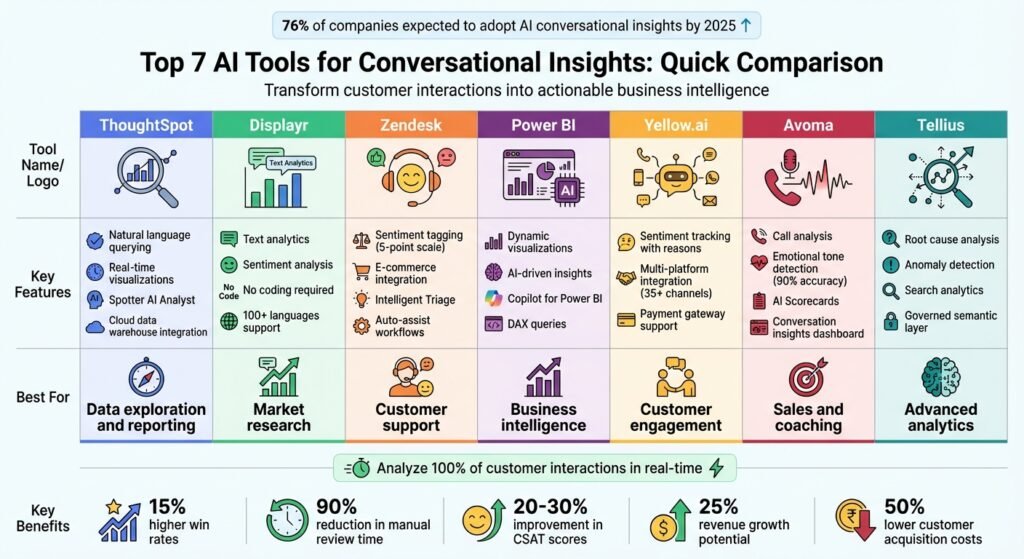
Comparison of 7 AI-Driven Conversational Insights Tools: Features and Best Use Cases
1. ThoughtSpot
Natural language querying capabilities
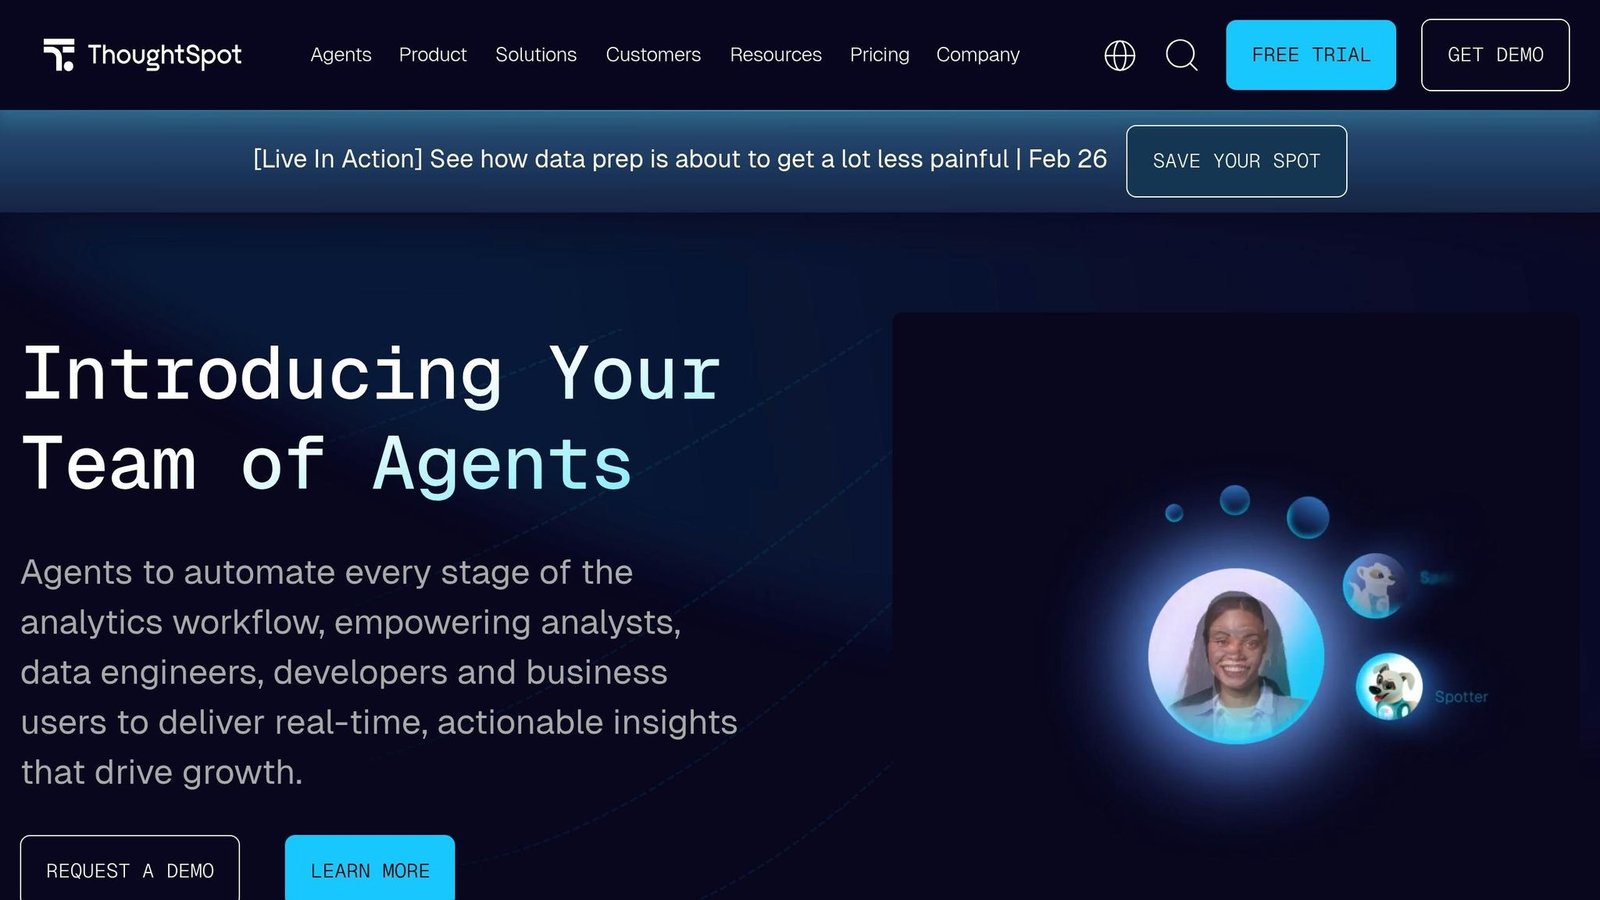
ThoughtSpot’s Spotter AI Analyst makes exploring data as simple as having a conversation. Instead of crafting complex queries, you can type straightforward questions like, “What drove revenue growth last quarter?” or “What are the top-selling products in California?”. Its natural language processing (NLP) interprets your intent by recognizing entities like product names or regions, understanding your goal (e.g., comparing or forecasting), and maintaining the context of the conversation.
The system also remembers previous questions, allowing follow-ups to flow naturally. For example, after viewing national sales data, you can ask, “What about California?” without starting from scratch. Customer adoption figures and a customer quotation previously printed here could not be attributed to a checkable source and have been removed.
Visualization and reporting features
ThoughtSpot turns conversational queries into visualizations, tables, or text summaries automatically. Its Liveboards provide real-time dashboards that refresh as new data enters your cloud warehouse.
The platform also includes explainability features, showing the exact data sources, filters, and calculations behind each result – which is the part that decides whether anyone trusts the output. For advanced users, the Analyst Studio enables deeper exploration by blending conversational tools with custom SQL, Python, and R code. ThoughtSpot also pushes insights into Slack and Jira, so results land where teams already work.
Integration with e-commerce platforms
ThoughtSpot connects directly to cloud data warehouses such as Snowflake, Databricks, and Google BigQuery, delivering real-time insights tailored for e-commerce operations. Its Retail & Ecommerce solution allows businesses to track sales, monitor product performance, and analyze regional trends. For instance, you can ask, “Why did customer churn increase last month?” and receive automated segment comparisons that highlight related factors.
The practical constraint is upstream: ThoughtSpot reads what is in your warehouse. If conversation data never lands there, none of this applies.
2. Displayr
Natural language querying capabilities
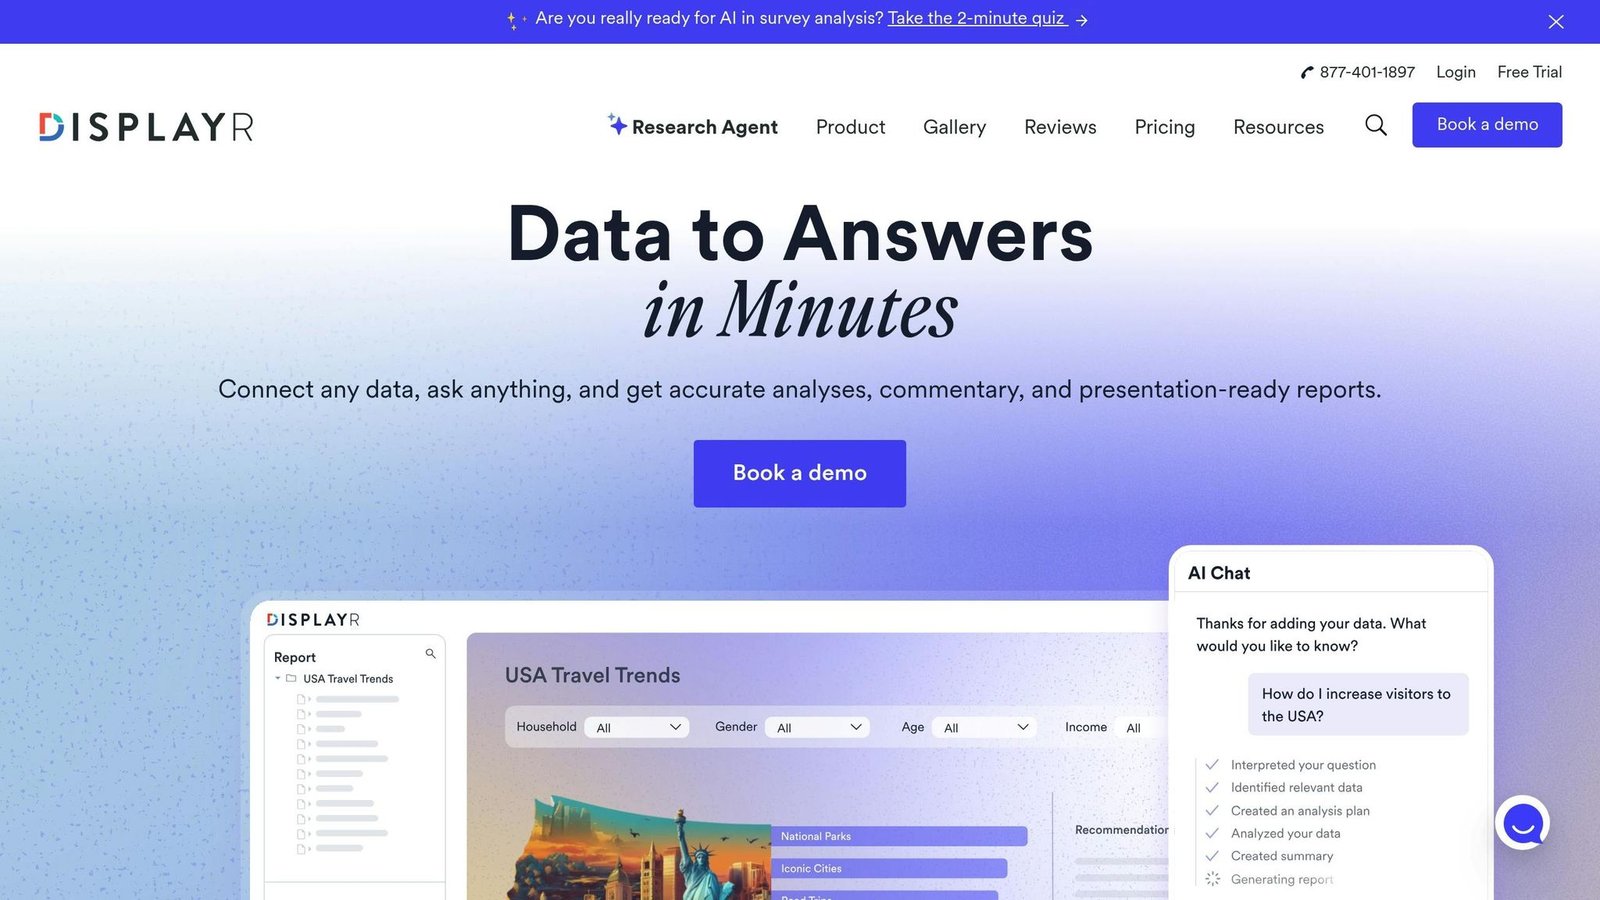
Displayr lets users ask questions in plain English, with no SQL required. You can type something like “How do I increase visitors to the USA?” and get a usable answer back. Its conversational interface lets you refine results with follow-up prompts, such as “split it by region” or “highlight top performers”, without starting over.
Unlike tools that rely on keywords, Displayr’s AI works from context and meaning, grouping open-text responses into themes across many languages. To address transparency concerns, the platform makes all logic, filters, and calculations visible. Customer counts and a review-site score previously quoted here could not be verified and have been removed.
Sentiment analysis and conversational insights
Displayr goes beyond positive-negative scoring, separating emotions such as frustration and disappointment, which is what tells you whether a complaint is about the product or the process. Its thematic coding automates the slowest part of open-text analysis, and Research Agents handle cleaning and reporting steps.
The platform also turns results into word clouds, charts, and interactive dashboards. These update automatically when new data is added and export directly to PowerPoint.
Integration with e-commerce platforms
Displayr connects to SQL databases, APIs, Excel, and CSV files, so it can take in unstructured material like product reviews and support verbatims. Its text analysis groups those verbatims into themes and tracks sentiment across languages.
It is a no-code platform, which is the point: market research teams can run advanced analysis without a data engineer. The trade-off is that it is built for research workflows rather than live operational dashboards.
3. Zendesk
Sentiment analysis and conversational insights
Zendesk’s Intelligent Triage evaluates support tickets and assigns sentiment ratings on a five-point scale: Very Positive, Positive, Neutral, Negative, and Very Negative. These ratings are automatically converted into tags (e.g., sentiment__negative), which trigger workflows to push upset customers to the front of the queue.
Zendesk’s AI Copilot also provides sentiment summaries and flags accounts whose interaction pattern looks like churn. Several named customer results previously printed in this section – satisfaction scores, ticket-volume reductions and a customer quotation – could not be sourced and have been removed.
What matters when you evaluate this: sentiment tagging is only useful if your routing rules actually act on the tag. The tagging itself changes nothing.
Integration with e-commerce platforms
Zendesk connects with e-commerce platforms like Shopify and Shopware through its Marketplace, allowing support agents to view real-time order histories, loyalty statuses, and customer activities directly in support tickets. The platform’s AI-powered “auto assist” features can handle specific tasks, such as processing Shopify refunds or cancellations, based on the intent and sentiment identified in customer messages.
Visualization and reporting features
Zendesk’s analytics tools let users build reports in plain English, supported by prebuilt dashboards covering workload, CSAT, and AI performance. The Automation Report tracks common customer intents and the historical impact of AI.
On price: Zendesk Suite Team starts at $55 per agent per month paid yearly, and Suite Professional at $115 per agent per month paid yearly. The AI and conversational-intelligence capabilities described above are not in the base Suite price – the Copilot add-on is a further $50 per agent per month paid yearly, and Suite Enterprise with Copilot is quoted by sales. Checked August 2026; confirm before budgeting, and budget for the add-on, not the headline.
4. Power BI

Natural language querying capabilities
Power BI, much like ThoughtSpot and Displayr, turns everyday questions into charts. Its Q&A feature lets users type questions directly into dashboards or reports in plain language. The system uses colour codes to indicate the clarity of queries: blue for correct, orange for low confidence, and red for unrecognized inputs.
Microsoft is steering users from the legacy Q&A experience towards Copilot for Power BI, its generative AI tool. Copilot can handle questions like “Top 10 products by sales” or “Which customers bought cheese and wine?”. To maintain accuracy, use the “clear chat” button when changing topics to reset the context. A dropdown menu shows the fields, measures, and filters Copilot used to generate its answers.
Visualization and reporting features
Power BI turns natural language queries into dynamic visualizations like line charts, bar charts, scatter plots, pie charts, tables, matrices, and maps. Its Copilot feature goes further, creating entire report pages, generating DAX queries, and producing narrative visuals for quick interpretation.
When interacting with Q&A visuals, selecting a data point triggers cross-filtering and highlighting across other visuals on the same page. Users can convert AI-generated visuals into standard Power BI visuals for extra customization or pin them to dashboards. The Tooling pane helps designers refine the AI’s understanding of business-specific terms by tracking unrecognized words and allowing the addition of synonyms.
The licensing catch is worth stating plainly: Copilot requires a paid Microsoft Fabric capacity (F2 or higher) or Power BI Premium capacity (P1 or higher). A Power BI Pro or Premium Per User licence alone will not do it, so the real cost of “AI in Power BI” is a capacity purchase, not a per-seat upgrade. Check current capacity pricing with Microsoft, as it is tiered by compute rather than by user.
5. Yellow.ai
Yellow.ai combines sentiment tracking with a wide set of channel and payment integrations, which is its main differentiator in this list.
Sentiment analysis and conversational insights
Yellow.ai’s in-house LLMs go beyond basic sentiment tracking by providing a “Sentiment Reason” for every interaction. This does not just flag that a customer is frustrated – it records why. Conversations are automatically grouped into topics like “Refund Policy” or “Technical Support”, which is what turns sentiment into something you can act on.
The timeline view tracks sentiment trends over time, so you can see whether a bot or policy change actually helped. Support teams can filter conversation logs by sentiment to find the failures and the automation gaps behind them. Vendor-published performance figures previously quoted here could not be verified and have been removed.
Integration with e-commerce platforms
Yellow.ai supports plug-and-play integrations with Shopify, WooCommerce, Magento, and Capillary. It also connects with payment gateways including Razorpay, PayU, Paytm, and Setu, so customers can complete a transaction inside the chat rather than being sent to a checkout page.
It covers a large number of voice and text channels, including WhatsApp, Facebook, and SMS. A named customer deployment and quotation previously printed here could not be attributed to a checkable source and have been removed. If your buyers are on WhatsApp – which in practice means South Asia, the Middle East and parts of Latin America – Yellow.ai is worth a look; if they are not, the channel breadth is wasted spend.
Visualization and reporting features
Yellow.ai’s Data Explorer provides prebuilt datasets and customizable widgets on shareable dashboards. The Topics Module groups conversations and scores each topic for automation opportunity, which is how you decide what to hand to a bot next.
Metrics such as deflection rate, Goal Completion Rate (GCR), CSAT, and First Response Time (FRT) are tracked on real-time dashboards. The platform excludes conversations with fewer than three messages from topic analysis so that abandoned sessions do not skew the picture. For voice agents, it provides both text transcripts and links to recordings.
6. Avoma
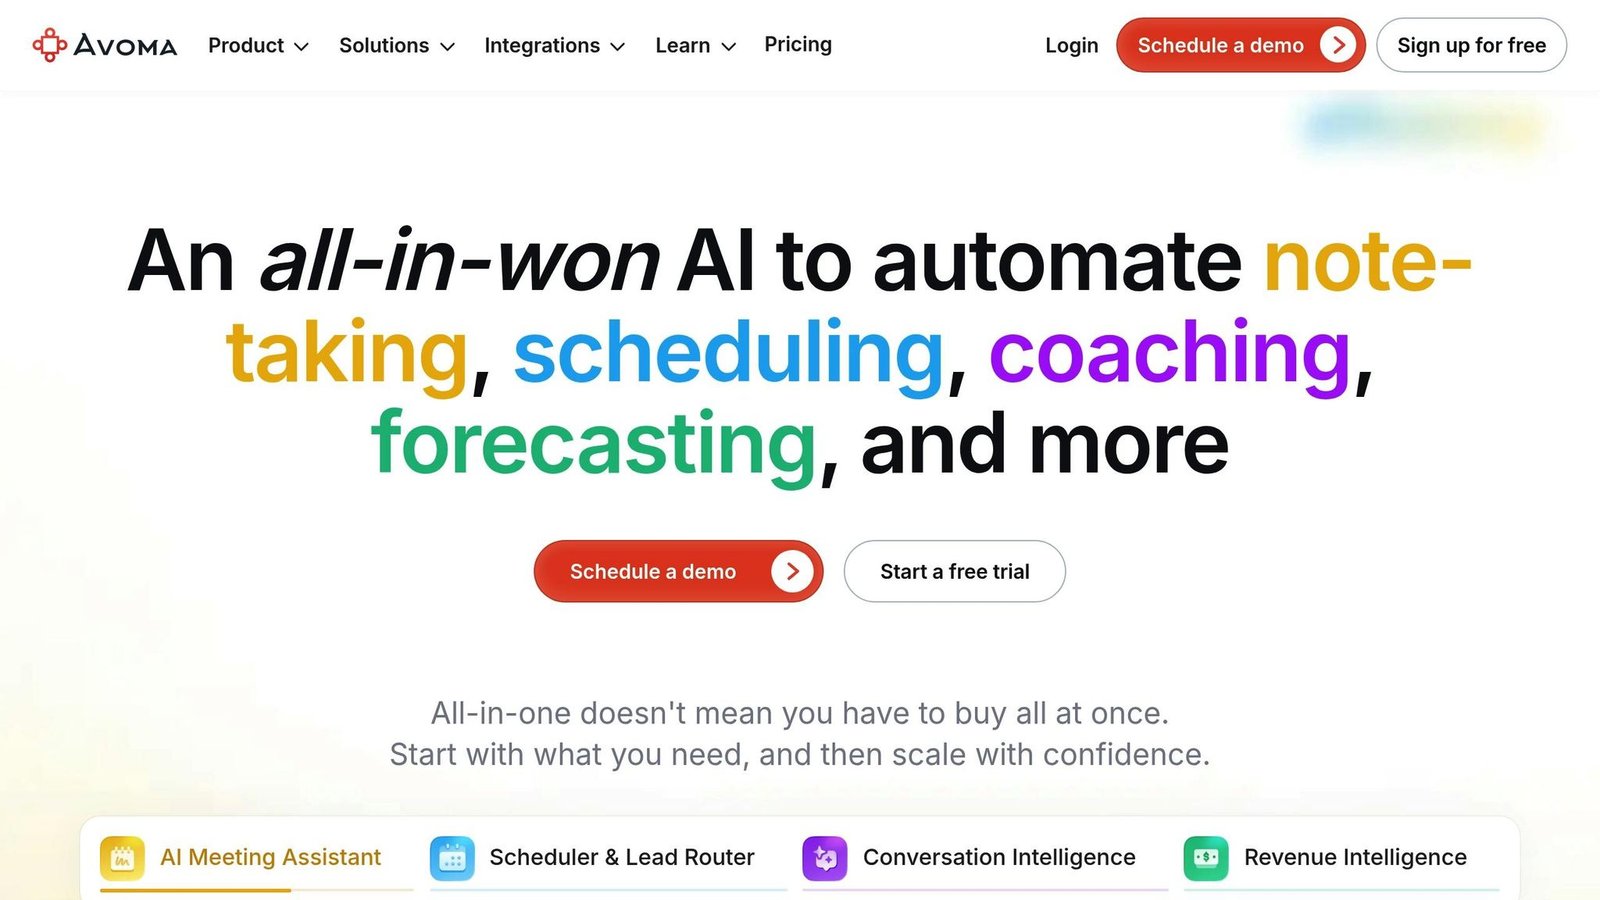
Avoma records customer calls and turns them into coaching material for sales and customer success teams. Accuracy claims for its tone detection, and win-rate figures, previously appeared here; neither could be sourced, so both have been removed.
Natural language querying capabilities
With the “Ask Avoma” feature, teams can locate specific calls by typing queries such as “show me calls with negative sentiment” or “find conversations where pricing objections were discussed.”
Sentiment analysis and conversational insights
Avoma analyses tone shifts, hesitation, and enthusiasm markers through a call and highlights the moments visually. Sentiment data is processed shortly after a call ends, and the platform can process historical recordings to establish a baseline. The useful output is comparative: which reps lose the room at the pricing conversation, and which do not.
Be realistic about what tone detection can do. It infers emotion from acoustic and lexical signals; accents, bad audio and second-language speakers all degrade it. Treat the scores as a way to find calls worth listening to, not as a measurement.
Visualization and reporting features
Avoma’s Conversation Insights Dashboard organizes data into Interactions, Topics, Trackers, and Custom Trends. The Interactions tab provides metrics such as talk-to-listen ratios and filler word usage. Topic Intelligence breaks down time spent on subjects like pricing, demos, or introductions. The Engagement Dashboard tracks total listening time and the percentage of reviewed calls. Avoma’s AI Scorecards evaluate calls against frameworks like MEDDIC or SPICED.
7. Tellius
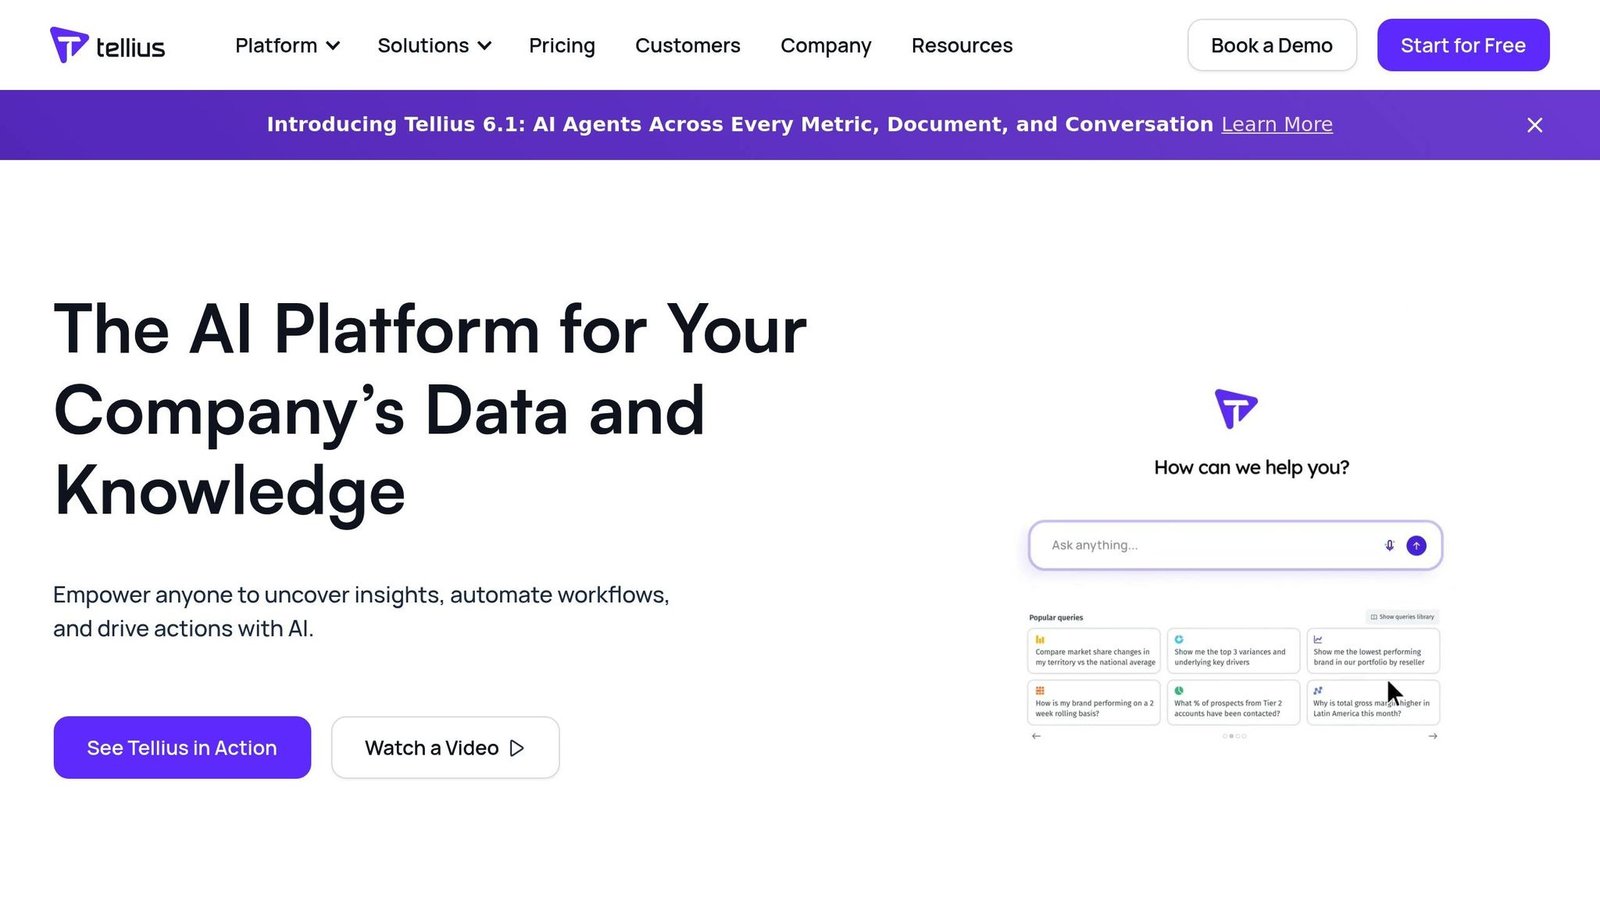
Tellius answers “what” happened and then tries to explain “why” a metric moved. It does this through a governed semantic layer that holds your organisation’s definitions of metrics, terms, and hierarchies, so a natural language question resolves against your definitions rather than the model’s guess. That is the real problem with general-purpose chat over a database: not that it cannot write SQL, but that it does not know what your company means by “active customer”.
Natural Language Querying Capabilities
Tellius keeps context across a conversation, so a follow-up like “now break that out by territory” works without restating the question. It combines anomaly detection, root cause analysis, and narrative generation in one workflow rather than three tools.
Two customer quotations and a set of time-saving figures previously printed in this section were anonymous or unsourceable and have been removed.
Integration with E-Commerce Platforms
Tellius consolidates data from multiple sources into one interface. It offers System Packs for industries like CPG and retail, with pre-built connectors for data sources such as Nielsen and Circana. Its built-in understanding of industry hierarchies means marketing teams can ask segment-level questions without first modelling the hierarchy themselves.
Visualization and Reporting Features
Tellius turns queries into real-time dashboards through its Vizpads feature. Its root cause decomposition ranks contributing factors with impact scores, which is the feature that distinguishes it from a conventional BI tool: it does not just show the drop, it ranks what moved with it.
Tellius was named a Visionary in the 2022 Gartner Magic Quadrant for Analytics and Business Intelligence Platforms and again in the 2023 report. Claims of a longer unbroken run, and of specific customer counts, could not be verified and have been removed.
Conclusion
The case for these tools does not need inflated numbers. Quarterly surveys sample a tiny, self-selecting slice of customers and arrive too late to act on. Conversational insight tools read every interaction as it happens. That is a genuine difference in kind, and it is enough of an argument on its own.
Where the money actually goes is worth understanding before you buy. The licence is rarely the whole cost. For Zendesk, the AI capability is an add-on priced per agent on top of the Suite seat. For Power BI, Copilot needs a Fabric or Premium capacity, which is a compute purchase unrelated to your seat count. For the specialist tools, the cost that catches people out is integration: getting call recordings, chat logs and CRM records into one place with consistent customer identifiers. Budget for that work, because no vendor does it for free and every deployment needs it.
What decides whether you benefit is narrower than the marketing suggests. These tools produce findings; they do not act. If nobody owns the queue of findings – if there is no coach who runs the call reviews, no one who rewrites the help article the topic model keeps flagging – the subscription buys dashboards nobody opens. Volume matters too: below a few hundred conversations a month, patterns are not statistically meaningful and a person reading the tickets will do better.
Several outcome statistics previously printed in this section – win rates, review time, satisfaction gains, revenue growth, acquisition cost, and a claimed payback window – could not be traced to a published source, so they have been removed rather than repeated. Ask any vendor quoting figures like these for the underlying study, the sample size and who commissioned it. If they cannot produce it, treat the number as advertising.
Match the tool to the goal: sales coaching points to Avoma, support efficiency to Zendesk or Yellow.ai, research and open-text analysis to Displayr, and warehouse-scale exploration to ThoughtSpot, Power BI, or Tellius. Whether you are running a small business or an enterprise, run a paid pilot on your own data before committing. Demos run on the vendor’s data, which is always clean.
FAQs
How do I choose the right conversational insights tool for my business goals?
Start by pinpointing your main objective – sales, support, or operations. Most of these tools are built around one of those and are mediocre at the other two. Then look at the features that serve that objective: transcription accuracy, real-time processing, or CRM integration. Check how well the platform handles every channel you actually use, not just the one you use most. Finally, read user reviews with the specific complaint in mind rather than the star rating.
What data is needed to get useful conversational insights?
You need conversation data – transcripts or audio – that clearly identifies who said what, with timestamps and a customer identifier that matches your CRM. That last part is where most projects stall. Data that cannot be joined to a customer record produces sentiment scores with nothing to attach them to.
How can I measure ROI from conversational insights?
Pick metrics you already track and can baseline before the pilot: cost per ticket, first-contact resolution, handle time, win rate on coached versus uncoached reps. Run the pilot on one team rather than the whole company so you have a comparison group. Beware of attributing every improvement to the tool – support metrics move for seasonal reasons all the time. If you cannot state in advance what number would make you cancel, you are not measuring, you are justifying.
More on this topic
Browse all 20 articles on AI & Automation, or jump straight to our buying guide: Best Automation and Integration Tools.